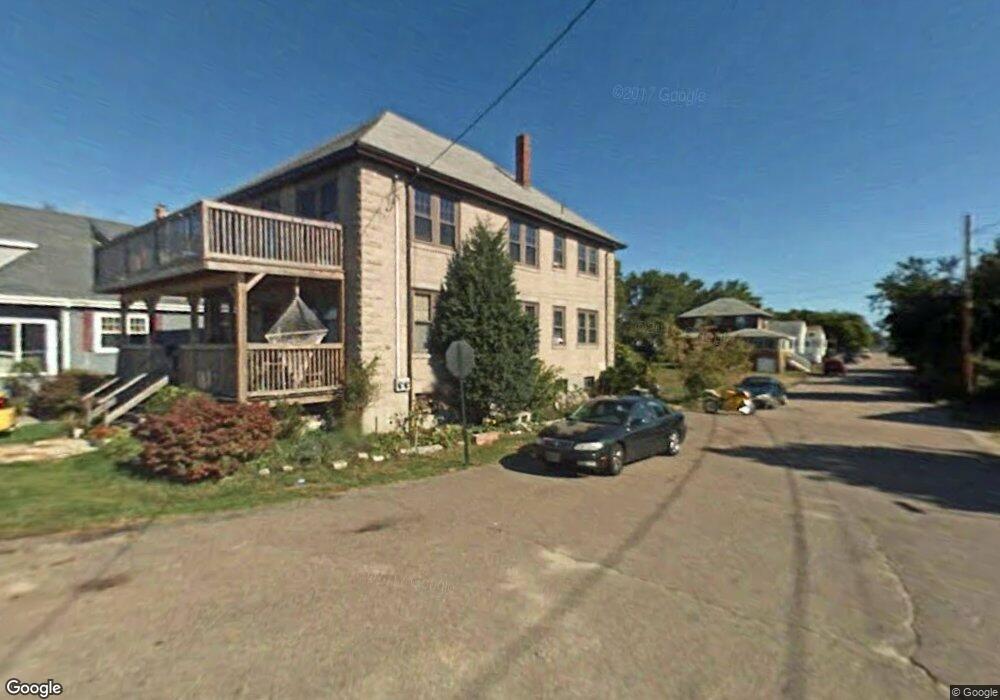
158 Newport Rd Hull, MA 02045
Whitehead NeighborhoodEstimated Value: $644,074 - $937,000
6
Beds
2
Baths
2,952
Sq Ft
$263/Sq Ft
Est. Value
About This Home
This home is located at 158 Newport Rd, Hull, MA 02045 and is currently estimated at $777,519, approximately $263 per square foot. 158 Newport Rd is a home located in Plymouth County with nearby schools including Lillian M. Jacobs Elementary School, Memorial Middle School, and Hull High School.
Ownership History
Date
Name
Owned For
Owner Type
Purchase Details
Closed on
Mar 17, 2015
Sold by
Green Alix
Bought by
Green Christopher S
Current Estimated Value
Purchase Details
Closed on
Jan 3, 1997
Sold by
Lappen Edward and Lieb Helene A
Bought by
Green Christopher S and Green Alix M
Home Financials for this Owner
Home Financials are based on the most recent Mortgage that was taken out on this home.
Original Mortgage
$114,750
Interest Rate
7.48%
Mortgage Type
Purchase Money Mortgage
Purchase Details
Closed on
Apr 17, 1987
Sold by
West Franklin W
Bought by
Lappen Edward N
Home Financials for this Owner
Home Financials are based on the most recent Mortgage that was taken out on this home.
Original Mortgage
$112,000
Interest Rate
8.97%
Mortgage Type
Purchase Money Mortgage
Create a Home Valuation Report for This Property
The Home Valuation Report is an in-depth analysis detailing your home's value as well as a comparison with similar homes in the area
Home Values in the Area
Average Home Value in this Area
Purchase History
| Date | Buyer | Sale Price | Title Company |
|---|---|---|---|
| Green Christopher S | -- | -- | |
| Green Christopher S | $127,500 | -- | |
| Lappen Edward N | $155,000 | -- |
Source: Public Records
Mortgage History
| Date | Status | Borrower | Loan Amount |
|---|---|---|---|
| Previous Owner | Lappen Edward N | $160,000 | |
| Previous Owner | Lappen Edward N | $135,000 | |
| Previous Owner | Lappen Edward N | $114,750 | |
| Previous Owner | Lappen Edward N | $112,000 |
Source: Public Records
Tax History Compared to Growth
Tax History
| Year | Tax Paid | Tax Assessment Tax Assessment Total Assessment is a certain percentage of the fair market value that is determined by local assessors to be the total taxable value of land and additions on the property. | Land | Improvement |
|---|---|---|---|---|
| 2025 | $5,709 | $509,700 | $214,400 | $295,300 |
| 2024 | $4,977 | $427,200 | $208,100 | $219,100 |
| 2023 | $5,094 | $418,600 | $208,100 | $210,500 |
| 2022 | $4,854 | $387,100 | $208,100 | $179,000 |
| 2021 | $4,879 | $384,800 | $189,200 | $195,600 |
| 2020 | $4,950 | $386,100 | $182,900 | $203,200 |
| 2019 | $4,703 | $360,400 | $176,600 | $183,800 |
| 2018 | $4,611 | $343,600 | $176,600 | $167,000 |
| 2017 | $4,714 | $343,600 | $176,600 | $167,000 |
| 2016 | $4,802 | $356,200 | $189,200 | $167,000 |
| 2015 | $4,526 | $324,700 | $157,700 | $167,000 |
| 2014 | $4,504 | $324,700 | $157,700 | $167,000 |
Source: Public Records
Map
Nearby Homes
- 158 Newport Rd Unit 1
- 158 Newport Rd-1st Fl- Waterfront Unit 1
- 164 Newport Rd
- 168 Newport Rd
- 126 Newport Rd
- 16 Bates St
- 30 Bates St
- 32 Bates St
- 25 Guild St
- 180 Newport Rd
- 34 Bates St
- 131 Newport Rd
- 15 Bates St
- 19 Bates St
- 36 Bates St
- 32 Guild St
- 29 Guild St
- 190 Newport Rd
- 15 Russell St
- 129 Newport Rd