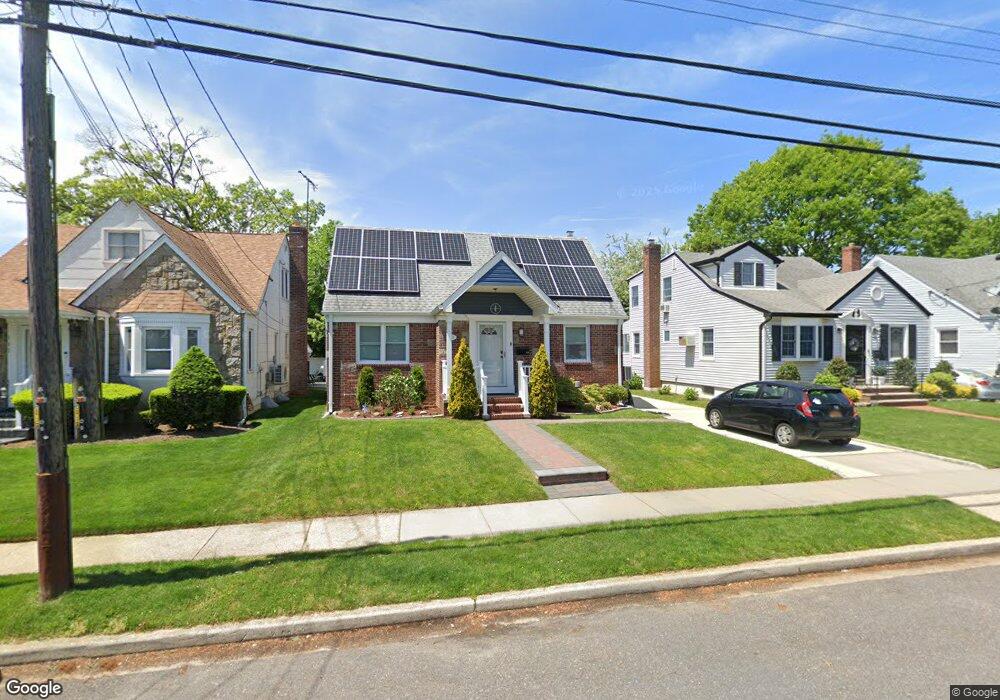
158 Ribbon St Franklin Square, NY 11010
Estimated Value: $711,514 - $779,000
3
Beds
1
Bath
1,232
Sq Ft
$605/Sq Ft
Est. Value
About This Home
This home is located at 158 Ribbon St, Franklin Square, NY 11010 and is currently estimated at $745,257, approximately $604 per square foot. 158 Ribbon St is a home located in Nassau County with nearby schools including Hebrew Academy of Nassau County (HANC).
Ownership History
Date
Name
Owned For
Owner Type
Purchase Details
Closed on
Oct 25, 2017
Sold by
Agrusa Michael and Agrusa Angela
Bought by
Zheng Rixiao and Imoto Zheng Saori
Current Estimated Value
Home Financials for this Owner
Home Financials are based on the most recent Mortgage that was taken out on this home.
Original Mortgage
$200,000
Outstanding Balance
$167,502
Interest Rate
3.83%
Mortgage Type
New Conventional
Estimated Equity
$577,755
Purchase Details
Closed on
Jun 10, 2016
Sold by
Sarin Ashok and Khullar Geeta
Bought by
Agrusa Michael and Agrusa Angela
Home Financials for this Owner
Home Financials are based on the most recent Mortgage that was taken out on this home.
Original Mortgage
$325,000
Interest Rate
3.57%
Mortgage Type
New Conventional
Purchase Details
Closed on
Jan 4, 2016
Sold by
Jacovina Anthony C and Jacovina Revocable T Anthony C
Bought by
Sarin Ashok and Khullar Geeta
Create a Home Valuation Report for This Property
The Home Valuation Report is an in-depth analysis detailing your home's value as well as a comparison with similar homes in the area
Home Values in the Area
Average Home Value in this Area
Purchase History
| Date | Buyer | Sale Price | Title Company |
|---|---|---|---|
| Zheng Rixiao | $482,500 | Stewart Title | |
| Agrusa Michael | $452,500 | Judicial Title Insurance Age | |
| Sarin Ashok | $295,000 | The Judicial Title Ins | |
| Jacovina Anthony C | -- | The Judicial Title Ins |
Source: Public Records
Mortgage History
| Date | Status | Borrower | Loan Amount |
|---|---|---|---|
| Open | Zheng Rixiao | $200,000 | |
| Previous Owner | Agrusa Michael | $325,000 |
Source: Public Records
Tax History Compared to Growth
Tax History
| Year | Tax Paid | Tax Assessment Tax Assessment Total Assessment is a certain percentage of the fair market value that is determined by local assessors to be the total taxable value of land and additions on the property. | Land | Improvement |
|---|---|---|---|---|
| 2025 | $9,080 | $413 | $221 | $192 |
| 2024 | $3,813 | $434 | $232 | $202 |
| 2023 | $9,024 | $434 | $232 | $202 |
| 2022 | $9,024 | $434 | $232 | $202 |
| 2021 | $11,395 | $471 | $251 | $220 |
| 2020 | $10,021 | $662 | $398 | $264 |
| 2019 | $3,594 | $641 | $398 | $243 |
| 2018 | $3,444 | $641 | $0 | $0 |
| 2017 | $2,849 | $641 | $398 | $243 |
| 2016 | $5,946 | $641 | $398 | $243 |
| 2015 | $2,755 | $641 | $398 | $243 |
| 2014 | $2,755 | $641 | $398 | $243 |
| 2013 | $2,565 | $641 | $398 | $243 |
Source: Public Records
Map
Nearby Homes
- 144 Rintin St
- 56 Fendale St
- 190 Commonwealth St
- 31 Claflin Blvd
- 676 Sobo Ave
- 249 Grange St
- 149 Rule St
- 715 Iris St
- 594 Fenworth Blvd
- 775 Roosevelt St
- 231 Dogwood Ave
- 279 Semton Blvd
- 198 Guildford Ct
- 109 Caroline Ave
- 23 Monroe St
- 32 Madison Ave
- 146 Caroline Ave
- 242 James St
- 249 Hoffman St
- 170 Mckinley Ave