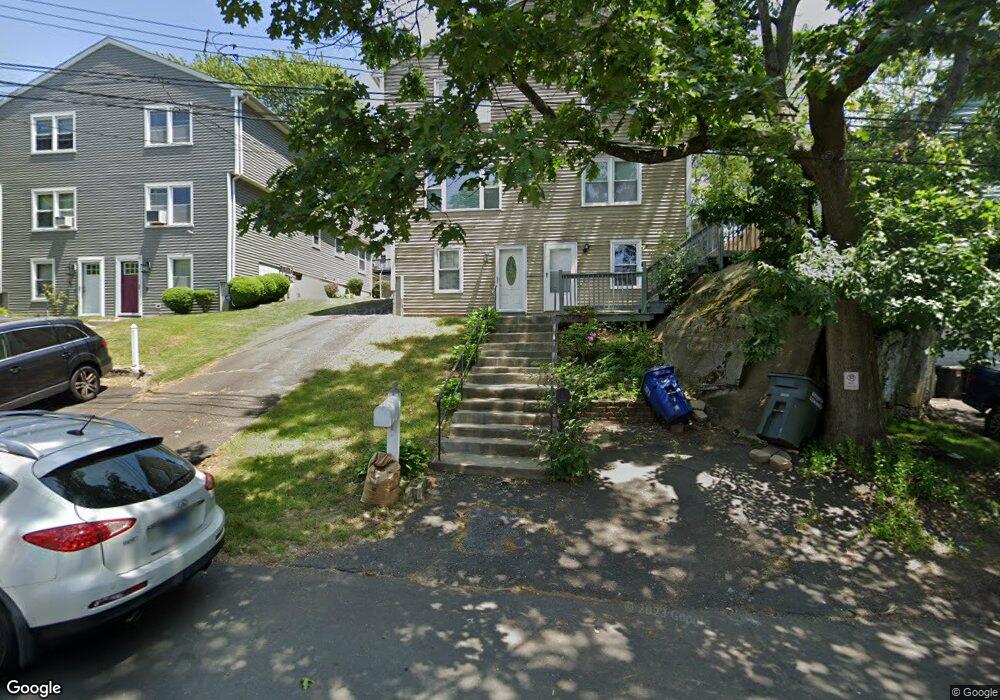
158 Robert St Bridgeport, CT 06606
Reservoir-Whiskey Hill NeighborhoodEstimated Value: $313,000 - $358,000
3
Beds
2
Baths
1,302
Sq Ft
$262/Sq Ft
Est. Value
About This Home
This home is located at 158 Robert St, Bridgeport, CT 06606 and is currently estimated at $340,993, approximately $261 per square foot. 158 Robert St is a home located in Fairfield County with nearby schools including Hallen School, Central High School, and Northeastern Adventist Academy - Fairfield County.
Ownership History
Date
Name
Owned For
Owner Type
Purchase Details
Closed on
Dec 26, 1990
Sold by
Csigi Marianne
Bought by
Matias Sammy
Current Estimated Value
Home Financials for this Owner
Home Financials are based on the most recent Mortgage that was taken out on this home.
Original Mortgage
$113,500
Interest Rate
9.96%
Mortgage Type
Purchase Money Mortgage
Create a Home Valuation Report for This Property
The Home Valuation Report is an in-depth analysis detailing your home's value as well as a comparison with similar homes in the area
Home Values in the Area
Average Home Value in this Area
Purchase History
| Date | Buyer | Sale Price | Title Company |
|---|---|---|---|
| Matias Sammy | $115,000 | -- |
Source: Public Records
Mortgage History
| Date | Status | Borrower | Loan Amount |
|---|---|---|---|
| Closed | Matias Sammy | $23,000 | |
| Open | Matias Sammy | $123,500 | |
| Closed | Matias Sammy | $36,950 | |
| Closed | Matias Sammy | $113,500 |
Source: Public Records
Tax History
| Year | Tax Paid | Tax Assessment Tax Assessment Total Assessment is a certain percentage of the fair market value that is determined by local assessors to be the total taxable value of land and additions on the property. | Land | Improvement |
|---|---|---|---|---|
| 2025 | $5,884 | $135,425 | $25,375 | $110,050 |
| 2024 | $5,884 | $135,425 | $25,375 | $110,050 |
| 2023 | $5,884 | $135,425 | $25,375 | $110,050 |
| 2022 | $5,884 | $135,425 | $25,375 | $110,050 |
| 2021 | $5,884 | $135,425 | $25,375 | $110,050 |
| 2020 | $3,884 | $71,930 | $12,000 | $59,930 |
| 2019 | $3,884 | $71,930 | $12,000 | $59,930 |
| 2018 | $3,911 | $71,930 | $12,000 | $59,930 |
| 2017 | $3,911 | $71,930 | $12,000 | $59,930 |
| 2016 | $3,911 | $71,930 | $12,000 | $59,930 |
| 2015 | $3,859 | $91,450 | $16,200 | $75,250 |
| 2014 | $3,859 | $91,450 | $16,200 | $75,250 |
Source: Public Records
Map
Nearby Homes
- 125 Robert St
- 403 Indian Ave
- 474 Indian Ave
- 45 Polk St
- 355 Chamberlain Ave
- 245 Indian Ave
- 138 Infield St
- 28 Wilkins Ave
- 110 Wilkins Ave
- 940 Reservoir Ave
- 235 Douglas St
- 769 Sylvan Ave Unit 13
- 717 Reservoir Ave
- 705 Reservoir Ave
- 926 Hart St
- 916 Hart St
- 500 Woodlawn Avenue Extension
- 410 Alba Ave
- 475 Alba Ave
- 85 Platt St
Your Personal Tour Guide
Ask me questions while you tour the home.