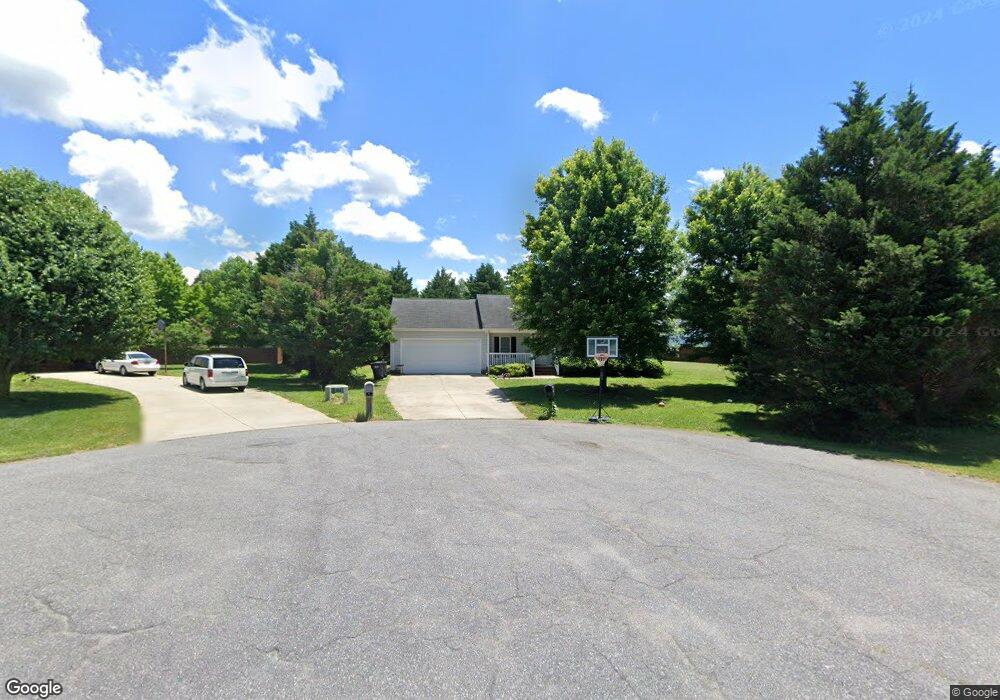
158 Rock Island Dr Statesville, NC 28625
Estimated Value: $296,000 - $365,000
3
Beds
2
Baths
2,092
Sq Ft
$150/Sq Ft
Est. Value
About This Home
This home is located at 158 Rock Island Dr, Statesville, NC 28625 and is currently estimated at $314,715, approximately $150 per square foot. 158 Rock Island Dr is a home located in Iredell County with nearby schools including Scotts Elementary School, Third Creek Middle School, and Statesville High School.
Ownership History
Date
Name
Owned For
Owner Type
Purchase Details
Closed on
Mar 8, 2023
Sold by
Wolf Kimberly L
Bought by
Oppy Bradley D and Hemenway Alanna M
Current Estimated Value
Home Financials for this Owner
Home Financials are based on the most recent Mortgage that was taken out on this home.
Original Mortgage
$250,381
Outstanding Balance
$242,520
Interest Rate
6.13%
Mortgage Type
FHA
Estimated Equity
$72,195
Purchase Details
Closed on
Jul 26, 2010
Sold by
Cook Matthew M
Bought by
Wolf Brian and Wolf Kimberly L
Purchase Details
Closed on
Sep 27, 2002
Sold by
Wcu Inc
Bought by
Cook Matthew M and Cook Lois
Home Financials for this Owner
Home Financials are based on the most recent Mortgage that was taken out on this home.
Original Mortgage
$96,000
Interest Rate
6.19%
Purchase Details
Closed on
Jul 31, 1997
Bought by
Borders Jack B and Borders Mildred T
Create a Home Valuation Report for This Property
The Home Valuation Report is an in-depth analysis detailing your home's value as well as a comparison with similar homes in the area
Home Values in the Area
Average Home Value in this Area
Purchase History
| Date | Buyer | Sale Price | Title Company |
|---|---|---|---|
| Oppy Bradley D | $255,000 | -- | |
| Wolf Brian | $117,000 | None Available | |
| Cook Matthew M | $120,000 | -- | |
| Borders Jack B | $137,500 | -- |
Source: Public Records
Mortgage History
| Date | Status | Borrower | Loan Amount |
|---|---|---|---|
| Open | Oppy Bradley D | $250,381 | |
| Previous Owner | Cook Matthew M | $96,000 |
Source: Public Records
Tax History Compared to Growth
Tax History
| Year | Tax Paid | Tax Assessment Tax Assessment Total Assessment is a certain percentage of the fair market value that is determined by local assessors to be the total taxable value of land and additions on the property. | Land | Improvement |
|---|---|---|---|---|
| 2024 | $1,437 | $233,350 | $42,000 | $191,350 |
| 2023 | $1,437 | $233,350 | $42,000 | $191,350 |
| 2022 | $866 | $128,440 | $18,000 | $110,440 |
| 2021 | $862 | $128,440 | $18,000 | $110,440 |
| 2020 | $862 | $128,440 | $18,000 | $110,440 |
| 2019 | $849 | $128,440 | $18,000 | $110,440 |
| 2018 | $794 | $124,120 | $19,000 | $105,120 |
| 2017 | $794 | $124,120 | $19,000 | $105,120 |
| 2016 | $794 | $124,120 | $19,000 | $105,120 |
| 2015 | $794 | $124,120 | $19,000 | $105,120 |
| 2014 | $706 | $117,760 | $13,500 | $104,260 |
Source: Public Records
Map
Nearby Homes
- 112 Clearview Rd
- 369 Cooper Farm Rd
- 154 Rock Island Dr
- 159 Rock Island Dr
- 104 Clearview Rd
- 120 Clearview Rd
- 375 Cooper Farm Rd
- 157 Rock Island Dr
- 153 Rock Island Dr
- 148 Rock Island Dr
- 148 Rock Island Dr Unit 18
- 124 Clearview Rd
- 111 Clearview Rd
- 147 Rock Island Dr
- 362 Cooper Farm Rd
- 117 Clearview Rd
- 121 Clearview Rd
- 128 Clearview Rd
- 142 Rock Island Dr
- 141 Rock Island Dr