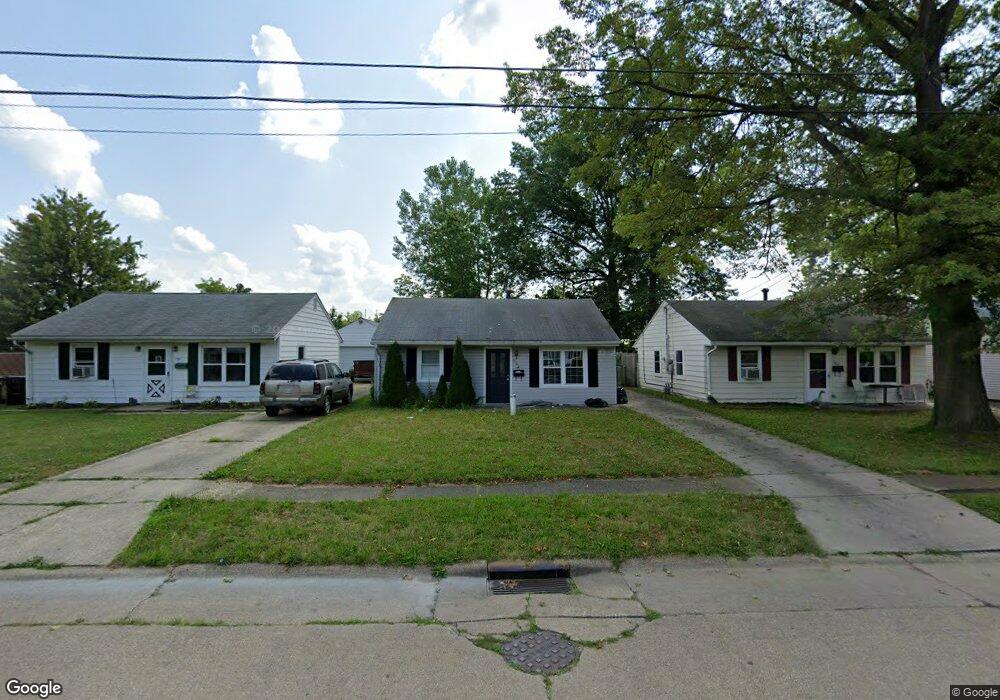
158 S Logan St Elyria, OH 44035
Estimated Value: $66,384 - $120,000
2
Beds
1
Bath
672
Sq Ft
$140/Sq Ft
Est. Value
About This Home
This home is located at 158 S Logan St, Elyria, OH 44035 and is currently estimated at $94,346, approximately $140 per square foot. 158 S Logan St is a home located in Lorain County with nearby schools including Eastern Heights Middle School, Elyria High School, and Constellation Schools: Elyria Community Elementary.
Ownership History
Date
Name
Owned For
Owner Type
Purchase Details
Closed on
Dec 23, 2021
Sold by
Gill Investments Llc
Bought by
Gunter Marcus
Current Estimated Value
Purchase Details
Closed on
Jan 24, 2005
Sold by
Gill Homes Inc
Bought by
Gill Investments Llc
Purchase Details
Closed on
Feb 7, 2003
Sold by
Daggett Susan L
Bought by
Gill Homes Inc
Home Financials for this Owner
Home Financials are based on the most recent Mortgage that was taken out on this home.
Original Mortgage
$54,750
Interest Rate
5.94%
Create a Home Valuation Report for This Property
The Home Valuation Report is an in-depth analysis detailing your home's value as well as a comparison with similar homes in the area
Home Values in the Area
Average Home Value in this Area
Purchase History
| Date | Buyer | Sale Price | Title Company |
|---|---|---|---|
| Gunter Marcus | $35,000 | Network Land Title Agency | |
| Gill Investments Llc | -- | -- | |
| Gill Homes Inc | $73,000 | Elyria Land Title |
Source: Public Records
Mortgage History
| Date | Status | Borrower | Loan Amount |
|---|---|---|---|
| Previous Owner | Gill Homes Inc | $54,750 |
Source: Public Records
Tax History
| Year | Tax Paid | Tax Assessment Tax Assessment Total Assessment is a certain percentage of the fair market value that is determined by local assessors to be the total taxable value of land and additions on the property. | Land | Improvement |
|---|---|---|---|---|
| 2024 | $1,132 | $23,338 | $6,685 | $16,653 |
| 2023 | $1,054 | $18,879 | $5,915 | $12,964 |
| 2022 | $1,025 | $18,879 | $5,915 | $12,964 |
| 2021 | $1,053 | $18,879 | $5,915 | $12,964 |
| 2020 | $1,016 | $16,210 | $5,080 | $11,130 |
| 2019 | $1,010 | $16,210 | $5,080 | $11,130 |
| 2018 | $1,012 | $16,210 | $5,080 | $11,130 |
| 2017 | $1,077 | $16,530 | $4,710 | $11,820 |
| 2016 | $1,063 | $16,530 | $4,710 | $11,820 |
| 2015 | $997 | $16,530 | $4,710 | $11,820 |
| 2014 | $986 | $16,530 | $4,710 | $11,820 |
| 2013 | $977 | $16,530 | $4,710 | $11,820 |
Source: Public Records
Map
Nearby Homes
- 171 S Logan St
- 805 Clark St
- 164 Woodbury St
- 324 Boston Ave
- 340 Boston Ave
- 609 Princeton Ave
- 453 Kenyon Ave
- 127 Beebe Ave
- 120 Longford Ave
- 147 Bellfield Ave
- 800 Boston Ave
- 144 Roosevelt Ave
- 817 Boston Ave
- 209 Clark St
- 355 Kenyon Ave
- 832 S Logan St
- 347 Kenyon Ave
- 147 Hamilton St
- 746 Delaware Ave
- 249 Roosevelt Ave
Your Personal Tour Guide
Ask me questions while you tour the home.