Estimated Value: $914,998 - $1,249,000
4
Beds
5
Baths
6,423
Sq Ft
$166/Sq Ft
Est. Value
About This Home
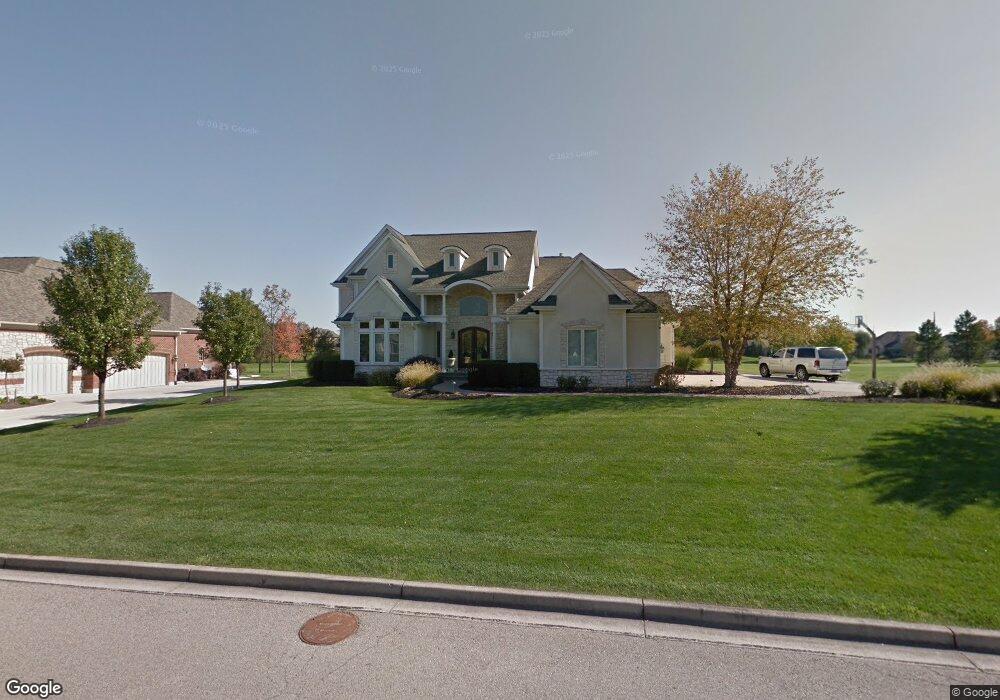
This home is located at 158 Signature Dr S, Xenia, OH 45385 and is currently estimated at $1,065,000, approximately $165 per square foot. 158 Signature Dr S is a home located in Greene County with nearby schools including Trebein Elementary School, Jacob Coy Middle School, and Beavercreek High School.
Ownership History
Date
Name
Owned For
Owner Type
Purchase Details
Closed on
Sep 30, 2020
Sold by
Walker Stanley Stacey and Stanley Ira H
Bought by
Crouch Debra Renee
Current Estimated Value
Purchase Details
Closed on
Jun 27, 2005
Sold by
Scott Sheila A
Bought by
Stanley Stacey Walker
Home Financials for this Owner
Home Financials are based on the most recent Mortgage that was taken out on this home.
Original Mortgage
$528,000
Interest Rate
7.87%
Mortgage Type
Fannie Mae Freddie Mac
Purchase Details
Closed on
Nov 13, 2000
Sold by
Nbl Development Group Ltd Partnership
Bought by
Scott David W and Scott Sheila A
Home Financials for this Owner
Home Financials are based on the most recent Mortgage that was taken out on this home.
Original Mortgage
$833,544
Interest Rate
7.87%
Mortgage Type
Balloon
Create a Home Valuation Report for This Property
The Home Valuation Report is an in-depth analysis detailing your home's value as well as a comparison with similar homes in the area
Home Values in the Area
Average Home Value in this Area
Purchase History
| Date | Buyer | Sale Price | Title Company |
|---|---|---|---|
| Crouch Debra Renee | $740,000 | None Available | |
| Stanley Stacey Walker | $660,000 | -- | |
| Scott David W | $130,000 | Midwest Abstract Company |
Source: Public Records
Mortgage History
| Date | Status | Borrower | Loan Amount |
|---|---|---|---|
| Previous Owner | Stanley Stacey Walker | $528,000 | |
| Previous Owner | Scott David W | $833,544 | |
| Closed | Scott David W | $52,500 |
Source: Public Records
Tax History Compared to Growth
Tax History
| Year | Tax Paid | Tax Assessment Tax Assessment Total Assessment is a certain percentage of the fair market value that is determined by local assessors to be the total taxable value of land and additions on the property. | Land | Improvement |
|---|---|---|---|---|
| 2024 | $16,699 | $282,760 | $29,980 | $252,780 |
| 2023 | $15,903 | $282,760 | $29,980 | $252,780 |
| 2022 | $16,104 | $245,850 | $29,980 | $215,870 |
| 2021 | $16,265 | $215,590 | $29,980 | $185,610 |
| 2020 | $14,331 | $215,590 | $29,980 | $185,610 |
| 2019 | $14,761 | $203,930 | $30,940 | $172,990 |
| 2018 | $12,906 | $203,930 | $30,940 | $172,990 |
| 2017 | $13,117 | $203,930 | $30,940 | $172,990 |
| 2016 | $12,938 | $201,600 | $30,940 | $170,660 |
| 2015 | $13,019 | $201,600 | $30,940 | $170,660 |
| 2014 | $12,725 | $201,600 | $30,940 | $170,660 |
Source: Public Records
Map
Nearby Homes
- 463 Valhalla Ct
- 295 Stratford Ln
- 185 Barrington Village Dr
- 2284 Annandale Place
- 90 Pawleys Plantation Ct
- 29 Governors Club Dr
- 33 Governors Club Dr
- 2176 Meridian Ct
- 153 George Wythe Way
- 131 Ridgebrook Trail
- 2580 Paydon Randoff Rd
- 705 Memorial Dr
- 79.4 acres Valley Springs Rd
- 179 Honey Jane Dr
- 3109 Indian Ripple Rd
- Cheswicke Plan at Sky Crossing
- Barrett Plan at Sky Crossing
- Nicholas Plan at Sky Crossing
- Hampton Plan at Sky Crossing
- Serenity Plan at Sky Crossing
- 146 Signature Dr S
- 163 Signature Dr S
- 163 Signature Dr S
- 2424 Valhalla Ct
- 0 Valhalla Ct Unit 565074
- 151 Signature Dr S
- 136 Signature Dr S
- 175 Signature Dr S
- 124 Signature Dr S
- 2429 Valhalla Private Ct
- 2423 Valhalla Ct
- 2429 Valhalla Ct
- 185 Signature Dr S
- 127 Signature Dr S
- 199 Signature Dr S
- 112 Signature Dr S
- 59.218 Acr N Indian Ripple Rd
- 0 Indian Ripple Rd Unit 1760343
- 0 Indian Ripple Rd Unit 612977
- 161 Wynstone Ct