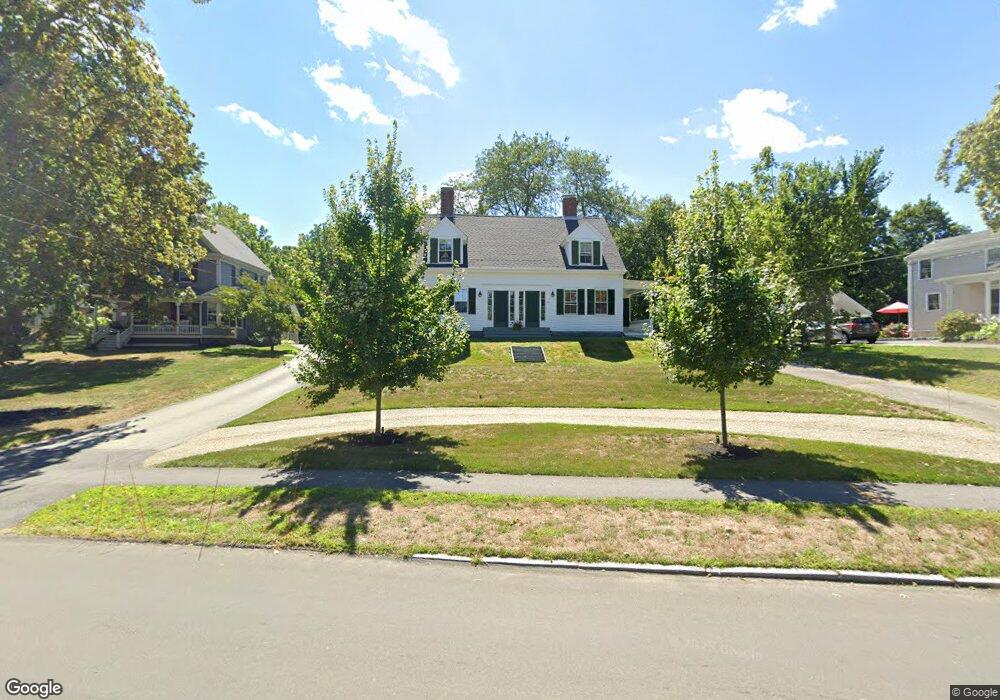
158 South St Unit 2 Hingham, MA 02043
Estimated Value: $706,000 - $922,000
3
Beds
3
Baths
1,711
Sq Ft
$485/Sq Ft
Est. Value
About This Home
This home is located at 158 South St Unit 2, Hingham, MA 02043 and is currently estimated at $829,435, approximately $484 per square foot. 158 South St Unit 2 is a home located in Plymouth County with nearby schools including William L. Foster Elementary School, St. Paul Elementary School, and Derby Academy.
Ownership History
Date
Name
Owned For
Owner Type
Purchase Details
Closed on
Nov 22, 1993
Sold by
158-160 South St Cdo T and Johnson Joseph
Bought by
Johnson Joseph and Johnson Louise
Current Estimated Value
Home Financials for this Owner
Home Financials are based on the most recent Mortgage that was taken out on this home.
Original Mortgage
$124,000
Interest Rate
6.77%
Mortgage Type
Purchase Money Mortgage
Create a Home Valuation Report for This Property
The Home Valuation Report is an in-depth analysis detailing your home's value as well as a comparison with similar homes in the area
Home Values in the Area
Average Home Value in this Area
Purchase History
| Date | Buyer | Sale Price | Title Company |
|---|---|---|---|
| Johnson Joseph | $150,000 | -- |
Source: Public Records
Mortgage History
| Date | Status | Borrower | Loan Amount |
|---|---|---|---|
| Open | Johnson Joseph | $15,000 | |
| Closed | Johnson Joseph | $124,000 |
Source: Public Records
Tax History Compared to Growth
Tax History
| Year | Tax Paid | Tax Assessment Tax Assessment Total Assessment is a certain percentage of the fair market value that is determined by local assessors to be the total taxable value of land and additions on the property. | Land | Improvement |
|---|---|---|---|---|
| 2025 | $6,073 | $568,100 | $0 | $568,100 |
| 2024 | $6,164 | $568,100 | $0 | $568,100 |
| 2023 | $4,985 | $498,500 | $0 | $498,500 |
| 2022 | $5,466 | $472,800 | $0 | $472,800 |
| 2021 | $6,003 | $472,800 | $0 | $472,800 |
| 2020 | $5,451 | $472,800 | $0 | $472,800 |
| 2019 | $5,584 | $472,800 | $0 | $472,800 |
| 2018 | $5,293 | $449,700 | $0 | $449,700 |
| 2017 | $5,449 | $444,800 | $0 | $444,800 |
| 2016 | $5,344 | $427,900 | $0 | $427,900 |
| 2015 | $5,291 | $422,300 | $0 | $422,300 |
Source: Public Records
Map
Nearby Homes
- 158 South St Unit 1
- 154 South St
- 164 South St
- 162 South St
- 152 South St
- 149 South St
- 149 South St Unit A
- 172 South St
- 143 South St
- 142 South St
- 178 South St Unit 4
- 176 South St Unit 4
- 176 South St Unit 2
- 176 South St Unit 1
- 214 North St
- 8 Hersey St
- 210 North St
- 222 North St
- 222 North St Unit 2
- 212 North St Unit 212