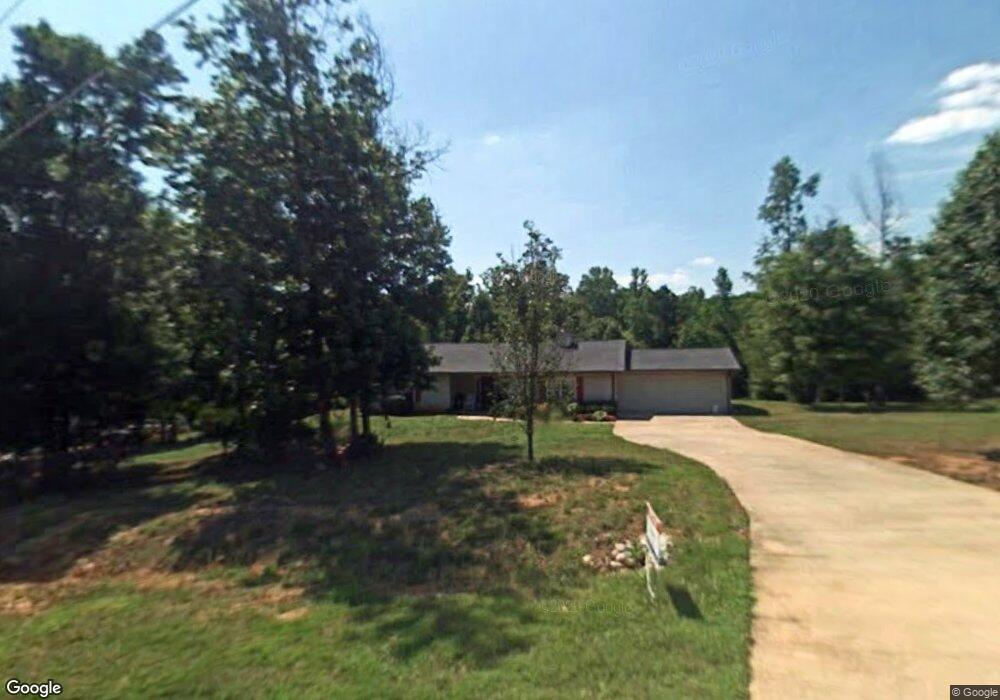
158 Swann Ct Unit 28 Jefferson, GA 30549
Estimated Value: $318,000 - $349,000
3
Beds
2
Baths
1,592
Sq Ft
$209/Sq Ft
Est. Value
About This Home
This home is located at 158 Swann Ct Unit 28, Jefferson, GA 30549 and is currently estimated at $331,994, approximately $208 per square foot. 158 Swann Ct Unit 28 is a home located in Jackson County with nearby schools including South Jackson Elementary School, East Jackson Middle School, and East Jackson Comprehensive High School.
Ownership History
Date
Name
Owned For
Owner Type
Purchase Details
Closed on
May 22, 2025
Sold by
Heim Courtney
Bought by
Mathews Brittany
Current Estimated Value
Home Financials for this Owner
Home Financials are based on the most recent Mortgage that was taken out on this home.
Original Mortgage
$330,896
Outstanding Balance
$330,331
Interest Rate
6.81%
Mortgage Type
FHA
Estimated Equity
$1,663
Purchase Details
Closed on
Feb 20, 2019
Sold by
Billionaires Funding Grp Llc
Bought by
Heim Dustin A and Heim Courtney
Home Financials for this Owner
Home Financials are based on the most recent Mortgage that was taken out on this home.
Original Mortgage
$172,660
Interest Rate
4.4%
Mortgage Type
New Conventional
Purchase Details
Closed on
Aug 7, 2018
Sold by
Keene James A
Bought by
Billionaires Funding Grp
Home Financials for this Owner
Home Financials are based on the most recent Mortgage that was taken out on this home.
Original Mortgage
$10,000,000
Interest Rate
4.5%
Mortgage Type
Commercial
Purchase Details
Closed on
May 29, 2013
Sold by
Smith Bessie L
Bought by
Keene James A
Home Financials for this Owner
Home Financials are based on the most recent Mortgage that was taken out on this home.
Original Mortgage
$78,551
Interest Rate
3.75%
Mortgage Type
FHA
Purchase Details
Closed on
Sep 25, 2000
Sold by
Mccall Roy W and Mccall Cynth
Bought by
Smith Bessie L
Purchase Details
Closed on
Jul 29, 1996
Bought by
Mccall Roy W and Mccall Cynth
Create a Home Valuation Report for This Property
The Home Valuation Report is an in-depth analysis detailing your home's value as well as a comparison with similar homes in the area
Home Values in the Area
Average Home Value in this Area
Purchase History
| Date | Buyer | Sale Price | Title Company |
|---|---|---|---|
| Mathews Brittany | $337,000 | -- | |
| Heim Dustin A | $178,000 | -- | |
| Billionaires Funding Grp | $102,000 | -- | |
| Keene James A | $80,000 | -- | |
| Smith Bessie L | -- | -- | |
| Mccall Roy W | $90,600 | -- |
Source: Public Records
Mortgage History
| Date | Status | Borrower | Loan Amount |
|---|---|---|---|
| Open | Mathews Brittany | $330,896 | |
| Previous Owner | Heim Dustin A | $175,050 | |
| Previous Owner | -- | $172,660 | |
| Previous Owner | -- | $7,120 | |
| Previous Owner | -- | $10,000,000 | |
| Previous Owner | Keene James A | $78,551 |
Source: Public Records
Tax History Compared to Growth
Tax History
| Year | Tax Paid | Tax Assessment Tax Assessment Total Assessment is a certain percentage of the fair market value that is determined by local assessors to be the total taxable value of land and additions on the property. | Land | Improvement |
|---|---|---|---|---|
| 2024 | $1,807 | $71,420 | $8,000 | $63,420 |
| 2023 | $1,800 | $63,188 | $8,000 | $55,188 |
| 2022 | $1,367 | $47,588 | $4,400 | $43,188 |
| 2021 | $1,376 | $47,588 | $4,400 | $43,188 |
| 2020 | $1,235 | $38,988 | $4,400 | $34,588 |
| 2019 | $1,254 | $38,988 | $4,400 | $34,588 |
| 2018 | $1,220 | $37,404 | $4,400 | $33,004 |
| 2017 | $1,186 | $36,070 | $4,400 | $31,670 |
| 2016 | $1,193 | $36,070 | $4,400 | $31,670 |
| 2015 | $1,198 | $36,070 | $4,400 | $31,670 |
| 2014 | $1,020 | $30,467 | $4,400 | $26,067 |
| 2013 | -- | $30,466 | $4,400 | $26,066 |
Source: Public Records
Map
Nearby Homes
- 77 Lakeview Ct
- 194 Adams Rd
- 00 Johnson Mill Rd
- 0 Johnson Mill Rd Unit 10556550
- 37 Carruth Rd
- 1268 Johnson Mill Rd
- 1003 Johnson Mill Rd
- 0 Berch Tree Trail Unit LOT 12
- 0 Berch Tree Trail Unit LOT 7
- 0 Berch Tree Trail Unit 7665580
- 0 Berch Tree Trail Unit 7665573
- 110 Rains Rd
- 405 Crimson Feather
- 205 Crimson Feather
- 115 Rains Rd
- 125 Rains Rd
- 144 Briar Rose Blvd
- 520 Virginia Ave
- 139 Anglin Rd
- 51 Brockton Way Unit 2