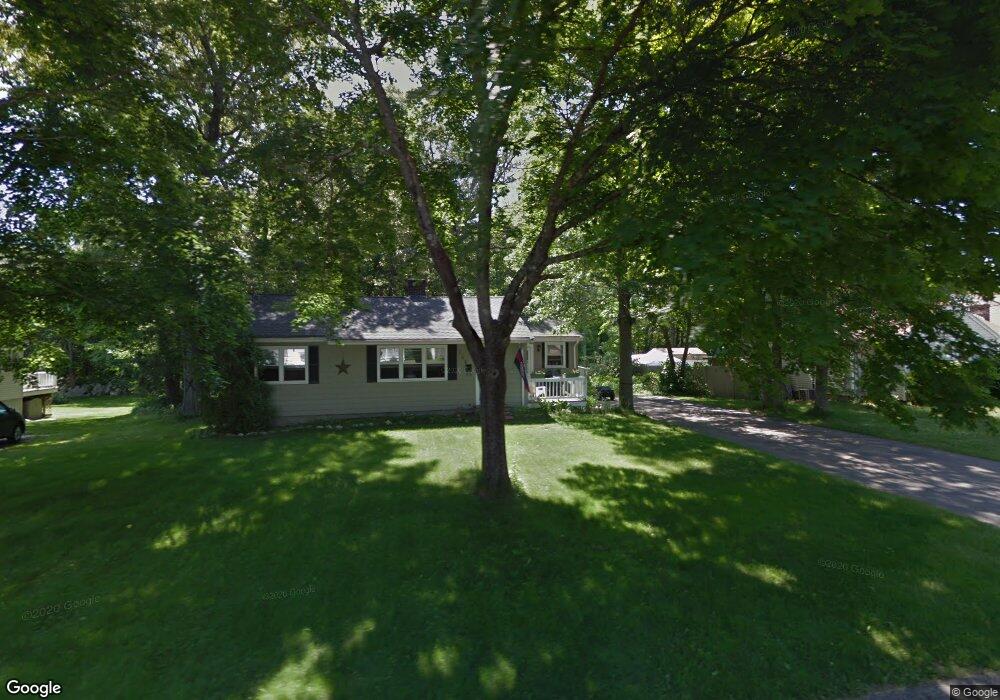
158 Wyman Rd Abington, MA 02351
Estimated Value: $492,000 - $548,000
3
Beds
1
Bath
1,008
Sq Ft
$518/Sq Ft
Est. Value
About This Home
This home is located at 158 Wyman Rd, Abington, MA 02351 and is currently estimated at $521,673, approximately $517 per square foot. 158 Wyman Rd is a home located in Plymouth County with nearby schools including Woodsdale School, Beaver Brook Elementary School, and Abington Middle School.
Ownership History
Date
Name
Owned For
Owner Type
Purchase Details
Closed on
Jul 29, 2019
Sold by
Devincentis Michael V
Bought by
Devincentis Michael V and Nelson Sherri A
Current Estimated Value
Home Financials for this Owner
Home Financials are based on the most recent Mortgage that was taken out on this home.
Original Mortgage
$241,758
Outstanding Balance
$211,866
Interest Rate
3.73%
Mortgage Type
FHA
Estimated Equity
$309,807
Purchase Details
Closed on
Jul 13, 2010
Sold by
Devincentis Claudia M
Bought by
Devincentis Michael
Create a Home Valuation Report for This Property
The Home Valuation Report is an in-depth analysis detailing your home's value as well as a comparison with similar homes in the area
Home Values in the Area
Average Home Value in this Area
Purchase History
| Date | Buyer | Sale Price | Title Company |
|---|---|---|---|
| Devincentis Michael V | -- | -- | |
| Devincentis Michael | -- | -- |
Source: Public Records
Mortgage History
| Date | Status | Borrower | Loan Amount |
|---|---|---|---|
| Open | Devincentis Michael V | $241,758 |
Source: Public Records
Tax History Compared to Growth
Tax History
| Year | Tax Paid | Tax Assessment Tax Assessment Total Assessment is a certain percentage of the fair market value that is determined by local assessors to be the total taxable value of land and additions on the property. | Land | Improvement |
|---|---|---|---|---|
| 2025 | $5,659 | $433,300 | $265,300 | $168,000 |
| 2024 | $5,470 | $408,800 | $241,400 | $167,400 |
| 2023 | $5,619 | $395,400 | $219,700 | $175,700 |
| 2022 | $5,307 | $348,700 | $183,400 | $165,300 |
| 2021 | $5,405 | $301,200 | $167,300 | $133,900 |
| 2020 | $6,069 | $298,200 | $168,500 | $129,700 |
| 2019 | $6,394 | $267,600 | $161,600 | $106,000 |
| 2018 | $6,479 | $264,600 | $161,600 | $103,000 |
| 2017 | $4,466 | $243,400 | $161,600 | $81,800 |
| 2016 | $3,997 | $222,900 | $147,400 | $75,500 |
| 2015 | $3,681 | $216,500 | $147,400 | $69,100 |
Source: Public Records
Map
Nearby Homes
- 337 Randolph St
- 28 Sylvan Ct
- 1085 Bedford St
- 1077 Bedford St
- 5 Chamberlain St
- 1353 Washington St
- 0 Bedford St
- 1210 Washington St
- 20 Cleverly St Unit B2
- 676 Bedford St
- 29 West St
- 120 Glen St
- 57 Battery St
- 14 Kingswood Dr Unit 3
- 14 Jamieson St
- 451 Lincoln St
- 44 Old Forge Rd
- 840 Hancock St
- 57 Sheri Ln
- 332 Hancock St