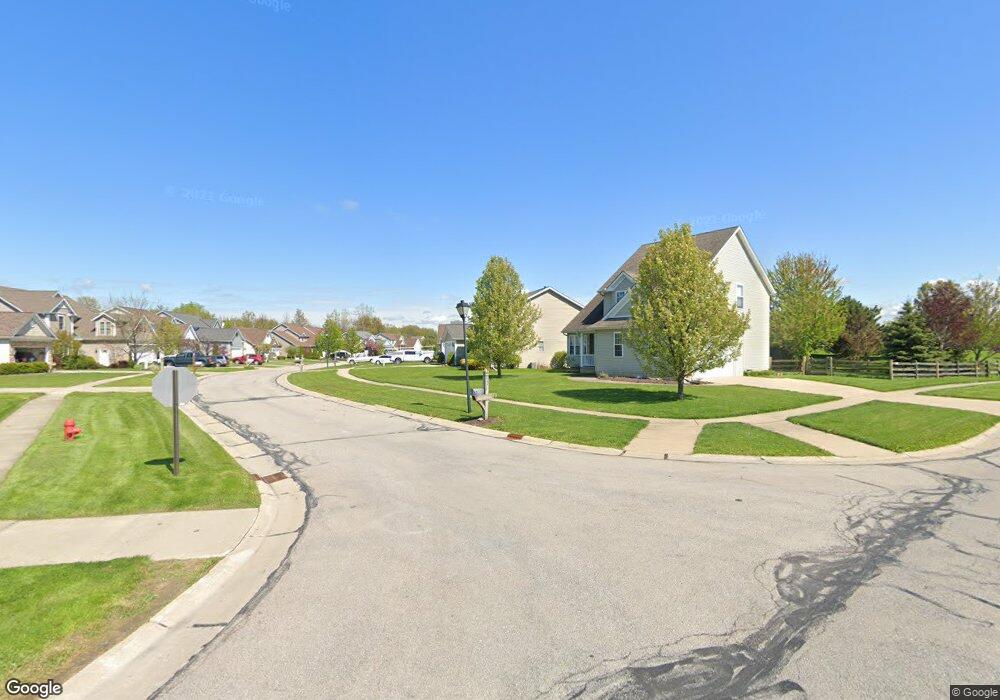
1580 Clipper Cove Painesville, OH 44077
Estimated Value: $282,000 - $341,000
3
Beds
3
Baths
1,694
Sq Ft
$183/Sq Ft
Est. Value
About This Home
This home is located at 1580 Clipper Cove, Painesville, OH 44077 and is currently estimated at $310,624, approximately $183 per square foot. 1580 Clipper Cove is a home located in Lake County with nearby schools including Henry F. Lamuth Middle School, Riverside Junior/Senior High School, and Summit Academy Community School - Painesville.
Ownership History
Date
Name
Owned For
Owner Type
Purchase Details
Closed on
Dec 11, 2006
Sold by
Cendant Mobility Financial Corp
Bought by
Kovacs Mark J
Current Estimated Value
Home Financials for this Owner
Home Financials are based on the most recent Mortgage that was taken out on this home.
Original Mortgage
$186,200
Outstanding Balance
$110,707
Interest Rate
6.21%
Mortgage Type
Purchase Money Mortgage
Estimated Equity
$199,917
Purchase Details
Closed on
Nov 8, 2005
Sold by
Brkic Ante
Bought by
Cendant Mobility Financial Corp
Purchase Details
Closed on
Mar 24, 2004
Sold by
Canterbury Homes Inc
Bought by
Brkic Ante
Home Financials for this Owner
Home Financials are based on the most recent Mortgage that was taken out on this home.
Original Mortgage
$205,900
Interest Rate
5.74%
Mortgage Type
Purchase Money Mortgage
Purchase Details
Closed on
Mar 26, 2003
Sold by
Lake Erie Shores Development Llc
Bought by
Key West Investment Corp
Create a Home Valuation Report for This Property
The Home Valuation Report is an in-depth analysis detailing your home's value as well as a comparison with similar homes in the area
Home Values in the Area
Average Home Value in this Area
Purchase History
| Date | Buyer | Sale Price | Title Company |
|---|---|---|---|
| Kovacs Mark J | $186,800 | Attorney | |
| Cendant Mobility Financial Corp | $213,800 | None Available | |
| Brkic Ante | $205,900 | Chicago Title Insurance Co | |
| Canterbury Homes Inc | -- | Chicago Title Insurance Co | |
| Key West Investment Corp | $48,000 | Commonwealth Land Title |
Source: Public Records
Mortgage History
| Date | Status | Borrower | Loan Amount |
|---|---|---|---|
| Open | Kovacs Mark J | $186,200 | |
| Previous Owner | Brkic Ante | $205,900 |
Source: Public Records
Tax History Compared to Growth
Tax History
| Year | Tax Paid | Tax Assessment Tax Assessment Total Assessment is a certain percentage of the fair market value that is determined by local assessors to be the total taxable value of land and additions on the property. | Land | Improvement |
|---|---|---|---|---|
| 2024 | -- | $86,690 | $17,300 | $69,390 |
| 2023 | $7,094 | $65,100 | $13,450 | $51,650 |
| 2022 | $3,899 | $65,100 | $13,450 | $51,650 |
| 2021 | $3,912 | $65,100 | $13,450 | $51,650 |
| 2020 | $3,955 | $58,130 | $12,010 | $46,120 |
| 2019 | $3,985 | $58,130 | $12,010 | $46,120 |
| 2018 | $3,997 | $53,190 | $11,280 | $41,910 |
| 2017 | $3,774 | $53,190 | $11,280 | $41,910 |
| 2016 | $3,333 | $53,190 | $11,280 | $41,910 |
| 2015 | $3,044 | $53,190 | $11,280 | $41,910 |
| 2014 | $3,094 | $53,190 | $11,280 | $41,910 |
| 2013 | $3,024 | $53,190 | $11,280 | $41,910 |
Source: Public Records
Map
Nearby Homes
- 1679 Duffton Ln
- 1719 Duffton Ln
- 960 Robinhood Ave
- 1006 Robinhood Ave
- 124 Kenilworth Ave
- 961 Beachfront Dr
- 988 Oakwood Blvd
- 0 Bellevue Ave Unit 5152736
- 751 Bacon Rd
- 125 Sycamore Dr
- 0 Fremont Ave Unit 5152717
- 1978 Marsh Ln Unit 1978
- 720 N Creek Dr
- 1791 Muirfield Ln
- 1865 Marsh Ln Unit 1865
- 634 N Creek Dr
- 856 Beech Ave
- 547 Greenside Dr
- 499 Sand Trap Cir
- 389 Sand Trap Cir
- 1588 Clipper Cove
- 1574 Clipper Cove
- 1594 Clipper Cove
- 1600 Clipper Cove
- 1587 Clipper Cove
- 1581 Clipper Cove
- 1575 Clipper Cove
- 1575 Clipper Cove Unit 1
- 1051 Pebble Beach Cove
- 1595 Clipper Cove
- 1560 Clipper Cove
- 1599 Clipper Cove
- 1604 Clipper Cove
- 1020 Pebble Beach Cove
- 1550 Clipper Cove
- 1046 Pebble Beach Cove
- 1063 Pebble Beach Cove
- 1601 Clipper Cove
- 1608 Clipper Cove
- 1590 Commodore Cove