Estimated Value: $301,000 - $355,000
3
Beds
2
Baths
1,928
Sq Ft
$170/Sq Ft
Est. Value
About This Home
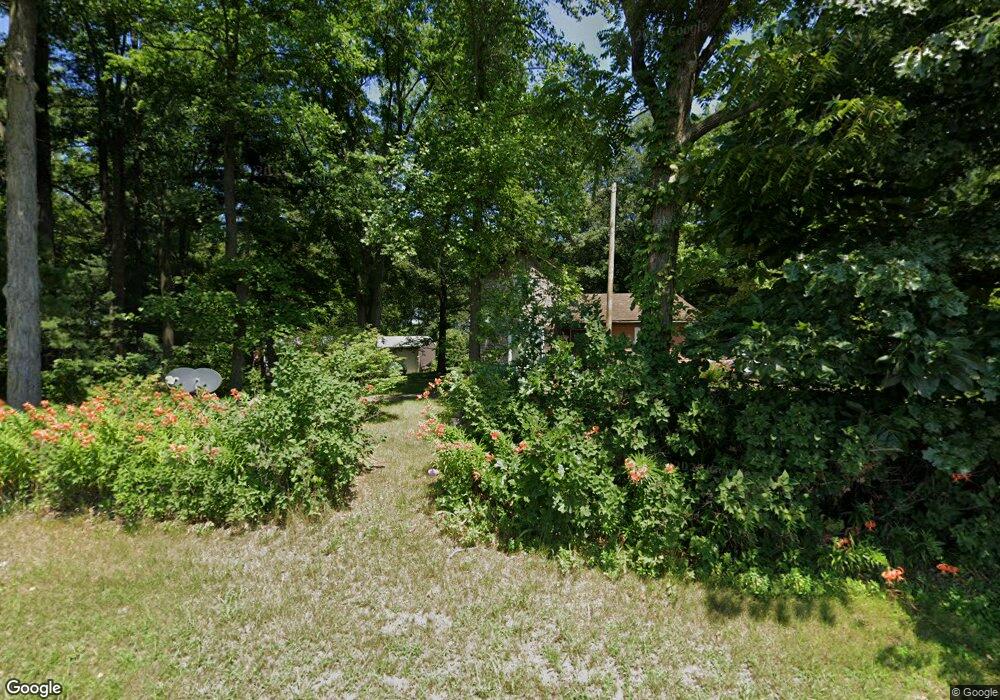
This home is located at 1580 E 500 N, Knox, IN 46534 and is currently estimated at $327,446, approximately $169 per square foot. 1580 E 500 N is a home located in Starke County with nearby schools including Oregon-Davis Elementary School and Oregon-Davis Junior/Senior High School.
Ownership History
Date
Name
Owned For
Owner Type
Purchase Details
Closed on
May 23, 2025
Sold by
Semans Dennis D and Semans Mary A
Bought by
Siedentop Family Farm Llc
Current Estimated Value
Purchase Details
Closed on
Jun 20, 2023
Sold by
Semans Dennis D and Semans Mary A
Bought by
Township Davis
Purchase Details
Closed on
Mar 9, 2020
Sold by
Semans Dennis D and Semans Mary A
Bought by
Nagai Lee
Purchase Details
Closed on
Apr 25, 2014
Sold by
Semans Dennis D and Semans Mary A
Bought by
Semans Mitchell D
Purchase Details
Closed on
Oct 24, 2009
Sold by
Semaus Dennis D and Semaus Mary A
Bought by
Langhans Ronald
Create a Home Valuation Report for This Property
The Home Valuation Report is an in-depth analysis detailing your home's value as well as a comparison with similar homes in the area
Purchase History
| Date | Buyer | Sale Price | Title Company |
|---|---|---|---|
| Siedentop Family Farm Llc | -- | First American Title | |
| Township Davis | -- | None Listed On Document | |
| Nagai Lee | -- | None Available | |
| Semans Mitchell D | -- | None Available | |
| Langhans Ronald | -- | None Available |
Source: Public Records
Tax History
| Year | Tax Paid | Tax Assessment Tax Assessment Total Assessment is a certain percentage of the fair market value that is determined by local assessors to be the total taxable value of land and additions on the property. | Land | Improvement |
|---|---|---|---|---|
| 2025 | $1,485 | $155,800 | $89,200 | $66,600 |
| 2024 | $1,485 | $157,700 | $93,200 | $64,500 |
| 2023 | $1,052 | $142,700 | $83,600 | $59,100 |
| 2022 | $1,052 | $123,200 | $68,000 | $55,200 |
| 2021 | $964 | $105,500 | $60,400 | $45,100 |
| 2020 | $1,711 | $121,300 | $79,700 | $41,600 |
| 2019 | $1,915 | $136,400 | $93,400 | $43,000 |
| 2018 | $1,924 | $136,500 | $95,000 | $41,500 |
| 2017 | $2,009 | $146,700 | $106,200 | $40,500 |
| 2016 | $2,046 | $150,300 | $111,000 | $39,300 |
| 2014 | $2,159 | $173,800 | $133,600 | $40,200 |
| 2013 | $1,614 | $149,900 | $110,000 | $39,900 |
Source: Public Records
Map
Nearby Homes
- 4170 E 250 N
- 4500 E 300 N
- 18097 S State Road 39
- 1615 N 300 E
- 0 Cr 600 N
- 202 S Jefferson St
- 68 S Jefferson St
- 66 S Jefferson St
- 109 S Jefferson St
- 2022 W 1800 S
- 18351 S Sr 39
- 18097 S Sr 39
- 101 S Hamlet St
- 205 W Pearl St
- 301 N Starke St
- 10 S Mccormick St
- 100 N Portland St
- 4420 N 700 E
- 10300 E 150 N
- V/L E 100 N
Your Personal Tour Guide
Ask me questions while you tour the home.