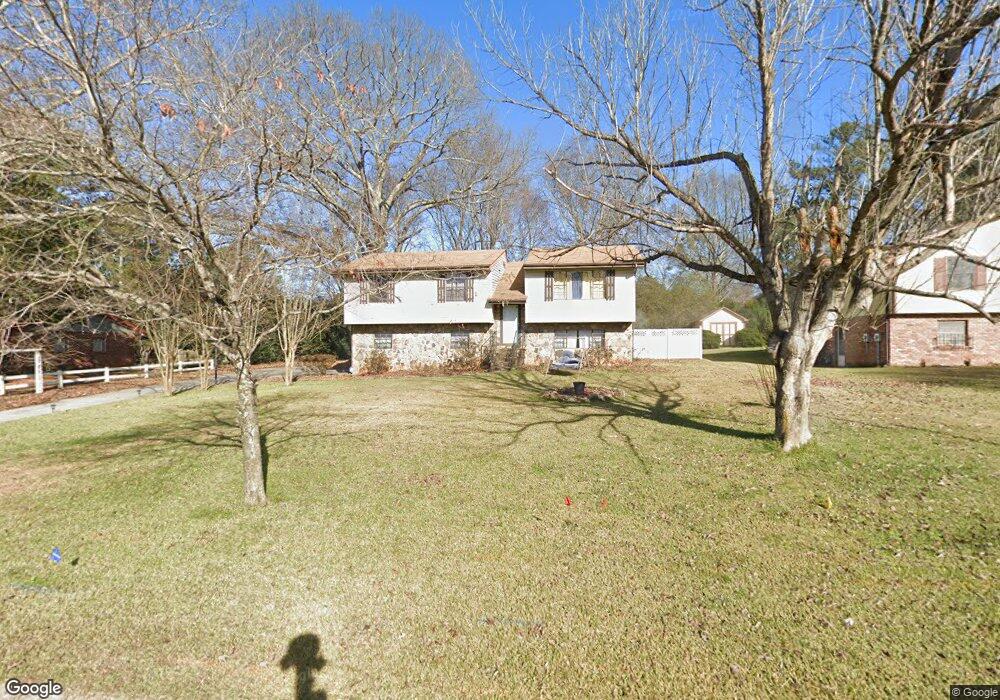
1580 Kidd Rd Jonesboro, GA 30236
Estimated Value: $239,737 - $254,000
4
Beds
2
Baths
1,816
Sq Ft
$135/Sq Ft
Est. Value
About This Home
This home is located at 1580 Kidd Rd, Jonesboro, GA 30236 and is currently estimated at $245,934, approximately $135 per square foot. 1580 Kidd Rd is a home located in Clayton County with nearby schools including James Jackson Elementary School, Jonesboro Middle School, and Jonesboro High School.
Ownership History
Date
Name
Owned For
Owner Type
Purchase Details
Closed on
Apr 30, 2021
Sold by
Frank Mileeka
Bought by
Johnson Courtney and Keener Tenacity
Current Estimated Value
Home Financials for this Owner
Home Financials are based on the most recent Mortgage that was taken out on this home.
Original Mortgage
$176,739
Outstanding Balance
$160,170
Interest Rate
3.1%
Mortgage Type
FHA
Estimated Equity
$85,764
Purchase Details
Closed on
Mar 22, 2019
Sold by
Warner Gregory L
Bought by
Frank Mileeka
Home Financials for this Owner
Home Financials are based on the most recent Mortgage that was taken out on this home.
Original Mortgage
$127,645
Interest Rate
4.37%
Mortgage Type
FHA
Purchase Details
Closed on
Mar 10, 2017
Sold by
Phillips Pamela Gail
Bought by
Warner Gregory L and Heusel Kerry A
Create a Home Valuation Report for This Property
The Home Valuation Report is an in-depth analysis detailing your home's value as well as a comparison with similar homes in the area
Home Values in the Area
Average Home Value in this Area
Purchase History
| Date | Buyer | Sale Price | Title Company |
|---|---|---|---|
| Johnson Courtney | $184,000 | -- | |
| Frank Mileeka | $130,000 | -- | |
| Warner Gregory L | $76,250 | -- |
Source: Public Records
Mortgage History
| Date | Status | Borrower | Loan Amount |
|---|---|---|---|
| Open | Johnson Courtney | $176,739 | |
| Previous Owner | Frank Mileeka | $127,645 |
Source: Public Records
Tax History Compared to Growth
Tax History
| Year | Tax Paid | Tax Assessment Tax Assessment Total Assessment is a certain percentage of the fair market value that is determined by local assessors to be the total taxable value of land and additions on the property. | Land | Improvement |
|---|---|---|---|---|
| 2024 | $3,048 | $88,120 | $8,000 | $80,120 |
| 2023 | $3,182 | $88,120 | $8,000 | $80,120 |
| 2022 | $2,496 | $73,600 | $7,320 | $66,280 |
| 2021 | $1,755 | $54,440 | $8,000 | $46,440 |
| 2020 | $1,680 | $52,000 | $8,000 | $44,000 |
| 2019 | $1,460 | $35,964 | $7,200 | $28,764 |
| 2018 | $1,238 | $30,500 | $7,200 | $23,300 |
| 2017 | $537 | $34,871 | $7,200 | $27,671 |
| 2016 | $421 | $29,479 | $7,200 | $22,279 |
| 2015 | $413 | $0 | $0 | $0 |
| 2014 | $382 | $29,234 | $7,200 | $22,034 |
Source: Public Records
Map
Nearby Homes
- 1608 Bogota Way
- 1699 Brenda Dr Unit 2
- 8033 Aloha Dr
- 1753 Brenda Dr
- 7620 Mount Zion Blvd
- 1732 Winding Woods Ln
- 7672 Echo Ln
- 1837 Coventry Way
- 139 Cecelia Cir
- 1904 Cades Cove
- 7621 Raleigh Ln
- 7581 Livingston Dr
- 7972 Woods Ln Unit IX
- 7431 Battlecreek Ln
- 1198 Spur 138
- 248 Commons Dr
- 1938 Wrights Way
- 7391 Garnet Dr
- 8356 Carlington Ln
- 8297 San Jose Trail
- 1570 Kidd Rd
- 1592 Kidd Rd
- 0 Kidd Rd Unit 8517387
- 0 Kidd Rd Unit 8116275
- 1581 Bogota Way
- 1581 Bogota Way Unit 5
- 1591 Bogota Way
- 1583 Kidd Rd
- 1560 Kidd Rd
- 1569 Bogota Way
- 1575 Kidd Rd
- 1550 Kidd Rd
- 1569 Kidd Rd
- 1621 Bogota Way
- 1605 Bogota Way
- 1615 Bogota Way
- 1595 Kidd Rd
- 1559 Bogota Way
- 1563 Kidd Rd
- 1548 Kidd Rd