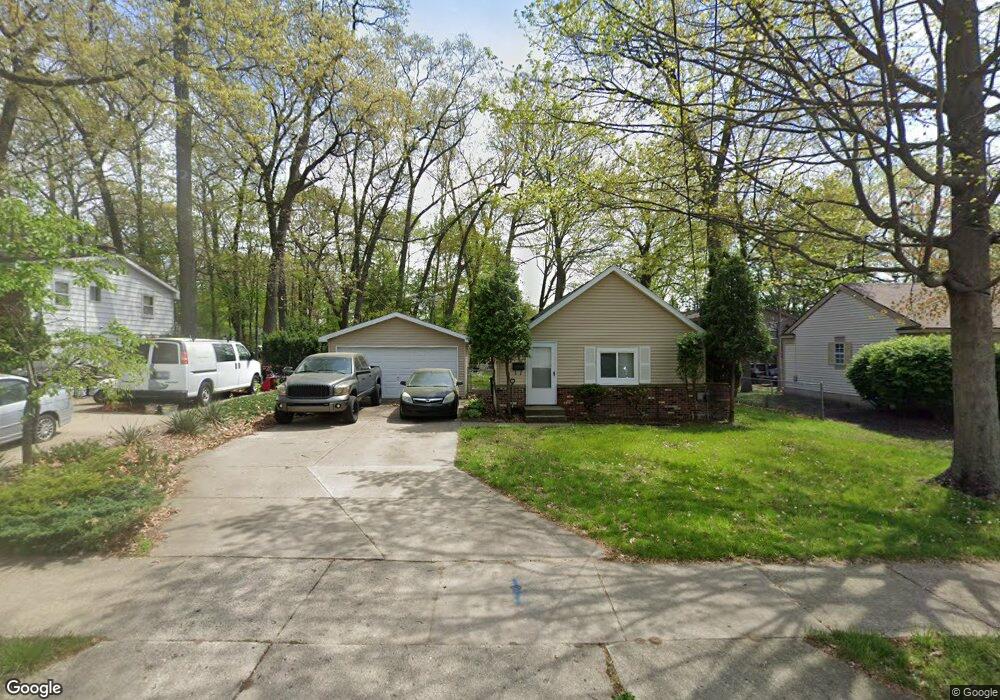
1580 Maplelawn St SW Wyoming, MI 49509
Oriole Park NeighborhoodEstimated Value: $208,163 - $243,000
2
Beds
1
Bath
1
Sq Ft
$221,791/Sq Ft
Est. Value
About This Home
This home is located at 1580 Maplelawn St SW, Wyoming, MI 49509 and is currently estimated at $221,791, approximately $221,791 per square foot. 1580 Maplelawn St SW is a home located in Kent County with nearby schools including Oriole Park Elementary School, West Elementary School, and Gladiola Elementary School.
Ownership History
Date
Name
Owned For
Owner Type
Purchase Details
Closed on
Jun 16, 2005
Sold by
Nardin Eugene J
Bought by
Nardin Properties Llc
Current Estimated Value
Purchase Details
Closed on
Jun 28, 1991
Sold by
Mccarren Michael J and Mccarren Jeanie J
Bought by
Nardin Eugene J and Nardin Properties Llc
Purchase Details
Closed on
Sep 21, 1984
Sold by
Thieme Thomas S and Thieme Jodie
Bought by
Mccarren Michael J and Nardin Properties Llc
Purchase Details
Closed on
Sep 17, 1984
Sold by
Bylsma Bernice R and Gabbert Charlene R
Bought by
Us Mutual Financial Corp and Nardin Properties Llc
Purchase Details
Closed on
Sep 13, 1984
Sold by
Radebaugh Byron F and Radebaugh Mildred M
Bought by
Thieme Thomas S and Nardin Properties Llc
Purchase Details
Closed on
Sep 12, 1984
Bought by
Gabbert Roger C and Nardin Properties Llc
Purchase Details
Closed on
Jul 29, 1983
Bought by
Us Mutual Financial Corp
Purchase Details
Closed on
Mar 15, 1982
Sold by
Rosales Richard R and Rosales Claudia S
Bought by
Radebaugh Byron F and Nardin Properties Llc
Create a Home Valuation Report for This Property
The Home Valuation Report is an in-depth analysis detailing your home's value as well as a comparison with similar homes in the area
Home Values in the Area
Average Home Value in this Area
Purchase History
| Date | Buyer | Sale Price | Title Company |
|---|---|---|---|
| Nardin Properties Llc | -- | -- | |
| Nardin Eugene J | -- | -- | |
| Mccarren Michael J | -- | -- | |
| Us Mutual Financial Corp | -- | -- | |
| Thieme Thomas S | -- | -- | |
| Gabbert Roger C | -- | -- | |
| Us Mutual Financial Corp | -- | -- | |
| Radebaugh Byron F | -- | -- |
Source: Public Records
Tax History Compared to Growth
Tax History
| Year | Tax Paid | Tax Assessment Tax Assessment Total Assessment is a certain percentage of the fair market value that is determined by local assessors to be the total taxable value of land and additions on the property. | Land | Improvement |
|---|---|---|---|---|
| 2025 | $2,290 | $89,500 | $0 | $0 |
| 2024 | $2,290 | $77,400 | $0 | $0 |
| 2023 | $2,336 | $71,000 | $0 | $0 |
| 2022 | $2,175 | $62,500 | $0 | $0 |
| 2021 | $2,118 | $58,600 | $0 | $0 |
| 2020 | $1,983 | $54,600 | $0 | $0 |
| 2019 | $2,070 | $48,800 | $0 | $0 |
| 2018 | $2,019 | $41,700 | $0 | $0 |
| 2017 | $1,973 | $36,400 | $0 | $0 |
| 2016 | $1,895 | $33,400 | $0 | $0 |
| 2015 | $1,881 | $33,400 | $0 | $0 |
| 2013 | -- | $31,600 | $0 | $0 |
Source: Public Records
Map
Nearby Homes
- 4190 Heron Ave SW
- 3983 Burlingame Ave SW
- 1335 Oriole Ct SW
- 1534 Beech St SW
- 4068 Flamingo Ave SW
- 4128 Michael Ave SW
- 4015 Milan Ave SW
- 4700 Burlingame Ave SW
- 4032 Oriole Ave SW
- 3756 Minnie Ave SW
- 3921 Colby Ave SW
- 4701 Ridgeland Ct SW
- 3817 Taft Ave SW
- 1277 Oakcrest St SW
- 2222 Knickerbocker St SW
- 3630 Raven Ave SW
- 1023 Ariebill St SW
- 4949 Chableau Dr SW
- 2246 Ancient Dr SW
- 3572 Flamingo Ave SW
- 1570 Maplelawn St SW
- 1590 Maplelawn St SW
- 4250 Burlingame Ave SW
- 4250 Burlingame Ave SW Unit 4252
- 1560 Maplelawn St SW
- 4262 Burlingame Ave SW
- 4262 Burlingame Ave SW Unit 4264
- 4210 Burlingame Ave SW
- 1577 Maplelawn St SW
- 1538 Maplelawn St SW
- 1565 Maplelawn St SW
- 1544 Southlawn Dr SW
- 4200 Burlingame Ave SW
- 1534 Southlawn Dr SW
- 1543 Maplelawn St SW
- 4280 Burlingame Ave SW
- 1524 Southlawn Dr SW
- 1531 Maplelawn St SW
- 4182 Burlingame Ave SW
- 1557 Southlawn Dr SW