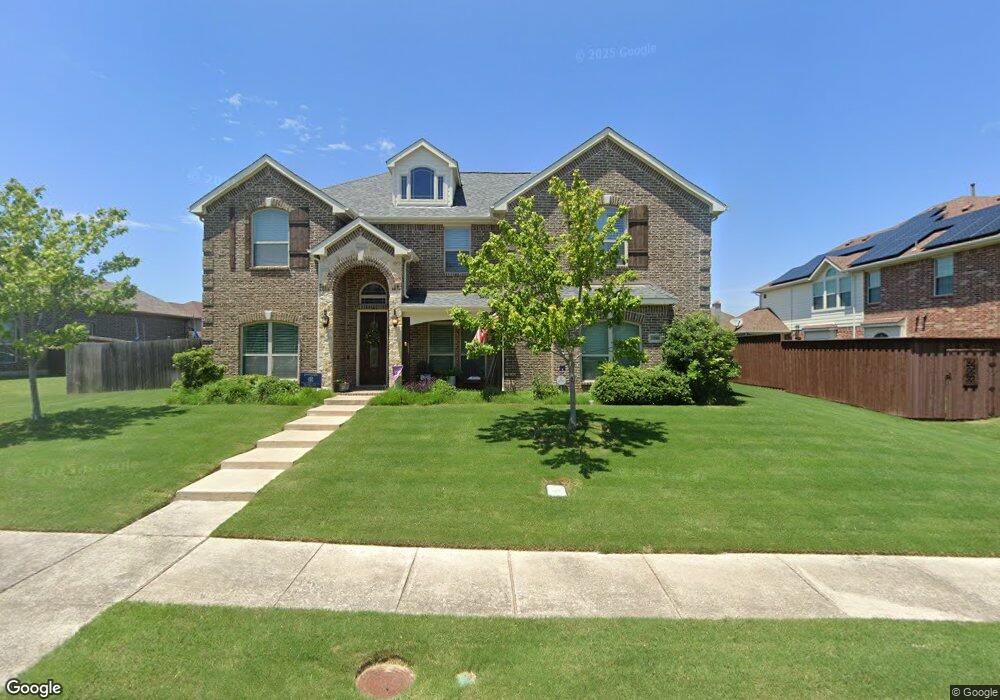
1580 N Hills Dr Rockwall, TX 75087
Estimated Value: $553,000 - $640,000
5
Beds
4
Baths
3,522
Sq Ft
$171/Sq Ft
Est. Value
About This Home
This home is located at 1580 N Hills Dr, Rockwall, TX 75087 and is currently estimated at $602,917, approximately $171 per square foot. 1580 N Hills Dr is a home with nearby schools including Virginia Reinhardt Elementary School, Herman E. Utley Middle School, and Rockwall High School.
Ownership History
Date
Name
Owned For
Owner Type
Purchase Details
Closed on
Jul 5, 2017
Sold by
Jamison Jamison K and Jamison Joyce T
Bought by
Cooper Travis and Cooper Michelle
Current Estimated Value
Home Financials for this Owner
Home Financials are based on the most recent Mortgage that was taken out on this home.
Original Mortgage
$368,086
Outstanding Balance
$312,773
Interest Rate
4.75%
Mortgage Type
FHA
Estimated Equity
$290,144
Purchase Details
Closed on
Mar 8, 2016
Bought by
Cooper Travis
Home Financials for this Owner
Home Financials are based on the most recent Mortgage that was taken out on this home.
Original Mortgage
$358,119
Interest Rate
3.64%
Purchase Details
Closed on
Sep 8, 2015
Sold by
Master Developers Snb Llc
Bought by
First Texas Homes Inc
Create a Home Valuation Report for This Property
The Home Valuation Report is an in-depth analysis detailing your home's value as well as a comparison with similar homes in the area
Home Values in the Area
Average Home Value in this Area
Purchase History
| Date | Buyer | Sale Price | Title Company |
|---|---|---|---|
| Cooper Travis | -- | Old Republic Title | |
| Cooper Travis | -- | Old Republic Title | |
| Cooper Travis | -- | -- | |
| First Texas Homes Inc | -- | Capital Title Of Texas Llc |
Source: Public Records
Mortgage History
| Date | Status | Borrower | Loan Amount |
|---|---|---|---|
| Open | Cooper Travis | $368,086 | |
| Previous Owner | Cooper Travis | $358,119 | |
| Previous Owner | Cooper Travis | -- |
Source: Public Records
Tax History Compared to Growth
Tax History
| Year | Tax Paid | Tax Assessment Tax Assessment Total Assessment is a certain percentage of the fair market value that is determined by local assessors to be the total taxable value of land and additions on the property. | Land | Improvement |
|---|---|---|---|---|
| 2025 | $9,242 | $591,159 | $105,000 | $486,159 |
| 2023 | $9,242 | $609,715 | $120,750 | $488,965 |
| 2022 | $10,361 | $575,750 | $108,150 | $467,600 |
| 2021 | $8,386 | $420,730 | $85,850 | $334,880 |
| 2020 | $8,719 | $422,670 | $64,200 | $358,470 |
| 2019 | $8,781 | $406,440 | $61,200 | $345,240 |
| 2018 | $9,074 | $409,960 | $61,200 | $348,760 |
| 2017 | $9,118 | $397,270 | $58,800 | $338,470 |
| 2016 | $6,255 | $272,540 | $60,000 | $212,540 |
| 2015 | $962 | $41,250 | $41,250 | $0 |
| 2014 | $962 | $41,250 | $41,250 | $0 |
Source: Public Records
Map
Nearby Homes
- 1590 N Hills Dr
- 1590 Sunset Hill Dr
- 610 Christan Ct
- 1608 Amesbury Ln
- 1116 Squaw Valley
- 1046 Courtney Cir
- 1245 Mission Dr
- 1822 Bayhill Dr
- 730 Monterey Dr
- 1745 Cresthill Dr
- 1105 Shores Blvd
- 420 E Coachlight Trail
- 217 Alta Vista Dr
- 1205 Shores Blvd
- 404 Westway Dr
- 907 Sunpoint Cir
- 2060 Garden Crest Dr
- 1900 Crestlake Dr
- 1235 Shores Blvd
- 1340 Fairlakes Pointe Dr
- 1582 N Hills Dr
- 1578 N Hills Dr
- 1579 Edmondson Trail
- 1581 N Hills Dr
- 1581 Edmondson Trail
- 1584 N Hills Dr
- 1577 Edmondson Trail
- 1583 N Hills Dr
- 1583 Edmondson Trail
- 1575 N Hills Dr
- 710 Belfort Dr
- 1585 N Hills Dr
- 712 Belfort Dr
- 1586 N Hills Dr
- 714 Belfort Dr
- 1585 Edmondson Trail
- 1573 N Hills Dr
- 1587 N Hills Dr
- 717 Belfort Dr
- 1580 Edmondson Trail