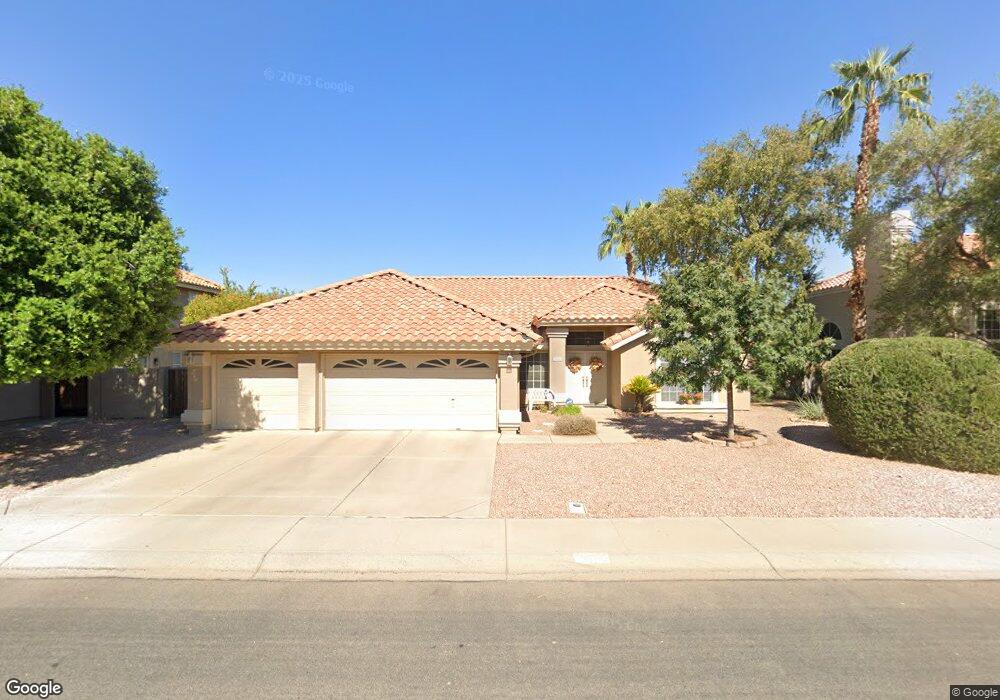
1580 W Kent Dr Chandler, AZ 85224
Central Ridge NeighborhoodEstimated Value: $508,510 - $644,000
--
Bed
3
Baths
2,186
Sq Ft
$274/Sq Ft
Est. Value
About This Home
This home is located at 1580 W Kent Dr, Chandler, AZ 85224 and is currently estimated at $599,378, approximately $274 per square foot. 1580 W Kent Dr is a home located in Maricopa County with nearby schools including Andersen Elementary School, Andersen Junior High School, and Chandler High School.
Ownership History
Date
Name
Owned For
Owner Type
Purchase Details
Closed on
Sep 14, 2015
Sold by
Endicott James T and Endicott Shelia D
Bought by
Endicott Living Trust and Endicott Shelia D
Current Estimated Value
Purchase Details
Closed on
Jun 25, 1999
Sold by
Rosia Timothy L and Rosia Laura L
Bought by
Endicott James T and Endicott Shelia D
Home Financials for this Owner
Home Financials are based on the most recent Mortgage that was taken out on this home.
Original Mortgage
$141,600
Outstanding Balance
$39,507
Interest Rate
7.51%
Mortgage Type
New Conventional
Estimated Equity
$559,871
Purchase Details
Closed on
Apr 18, 1996
Sold by
Vasquez Patricia A
Bought by
Rosia Timothy L and Rosia Laura L
Home Financials for this Owner
Home Financials are based on the most recent Mortgage that was taken out on this home.
Original Mortgage
$138,000
Interest Rate
9.25%
Mortgage Type
New Conventional
Create a Home Valuation Report for This Property
The Home Valuation Report is an in-depth analysis detailing your home's value as well as a comparison with similar homes in the area
Home Values in the Area
Average Home Value in this Area
Purchase History
| Date | Buyer | Sale Price | Title Company |
|---|---|---|---|
| Endicott Living Trust | -- | None Available | |
| Endicott James T | $177,000 | First American Title | |
| Rosia Timothy L | $153,367 | Chicago Title Insurance Co |
Source: Public Records
Mortgage History
| Date | Status | Borrower | Loan Amount |
|---|---|---|---|
| Open | Endicott James T | $141,600 | |
| Previous Owner | Rosia Timothy L | $138,000 | |
| Closed | Endicott James T | $17,700 |
Source: Public Records
Tax History Compared to Growth
Tax History
| Year | Tax Paid | Tax Assessment Tax Assessment Total Assessment is a certain percentage of the fair market value that is determined by local assessors to be the total taxable value of land and additions on the property. | Land | Improvement |
|---|---|---|---|---|
| 2025 | $2,049 | $26,301 | -- | -- |
| 2024 | $1,979 | $25,049 | -- | -- |
| 2023 | $1,979 | $44,130 | $8,820 | $35,310 |
| 2022 | $1,909 | $33,400 | $6,680 | $26,720 |
| 2021 | $2,001 | $31,100 | $6,220 | $24,880 |
| 2020 | $1,992 | $29,110 | $5,820 | $23,290 |
| 2019 | $1,916 | $27,570 | $5,510 | $22,060 |
| 2018 | $1,855 | $26,120 | $5,220 | $20,900 |
| 2017 | $1,729 | $25,110 | $5,020 | $20,090 |
| 2016 | $1,666 | $25,160 | $5,030 | $20,130 |
| 2015 | $1,614 | $22,820 | $4,560 | $18,260 |
Source: Public Records
Map
Nearby Homes
- 1640 W Gail Dr
- 1621 N Longmore St
- 1645 N Saguaro St
- 1323 W Manor St
- 1719 N Cholla St
- 1293 W Orchid Ln
- 1825 W Ray Rd Unit 2036
- 1825 W Ray Rd Unit 1068
- 1825 W Ray Rd Unit 1008
- 1825 W Ray Rd Unit 1063
- 1825 W Ray Rd Unit 1054
- 1825 W Ray Rd Unit 2070
- 1825 W Ray Rd Unit 2044
- 1825 W Ray Rd Unit 1083
- 1825 W Ray Rd Unit 2082
- 1825 W Ray Rd Unit 2052
- 1624 N Calle Cir
- 1260 N Salida Del Sol
- 1121 W Manor St
- 1367 N Los Altos Dr