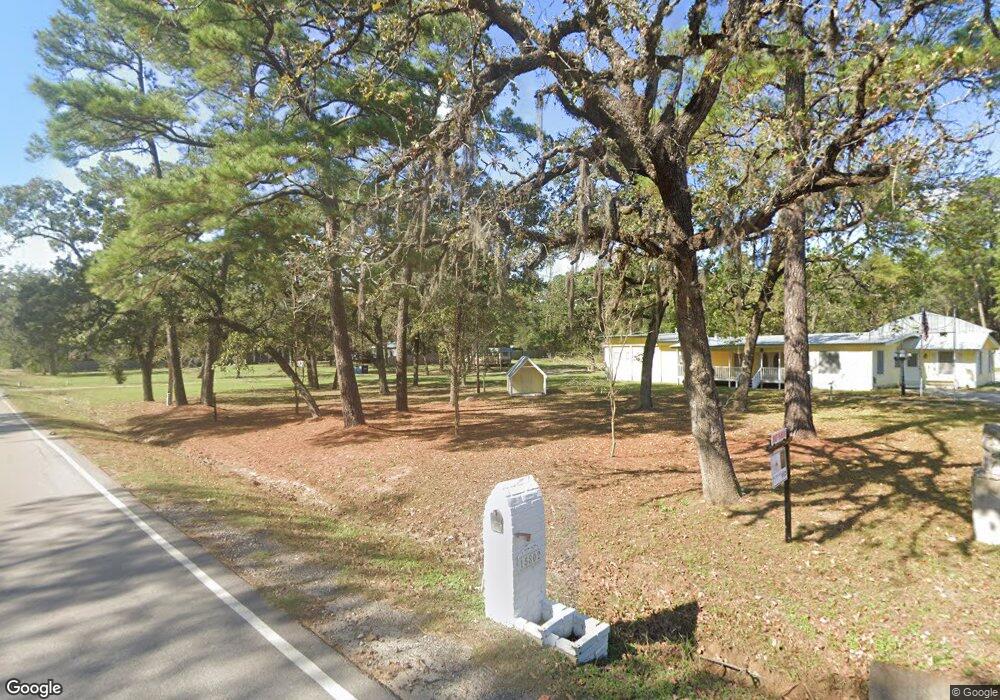
15802 Coe Loop Magnolia, TX 77355
Estimated Value: $429,000 - $684,000
3
Beds
2
Baths
2,637
Sq Ft
$199/Sq Ft
Est. Value
About This Home
This home is located at 15802 Coe Loop, Magnolia, TX 77355 and is currently estimated at $526,079, approximately $199 per square foot. 15802 Coe Loop is a home located in Montgomery County with nearby schools including J.L. Lyon Elementary School, Magnolia Sixth Grade Campus, and Magnolia Junior High School.
Ownership History
Date
Name
Owned For
Owner Type
Purchase Details
Closed on
Apr 26, 2022
Sold by
Bridgewater Management Trust
Bought by
Bermudez Carlos Mauricio
Current Estimated Value
Purchase Details
Closed on
Nov 4, 2003
Sold by
Bridgewater Floyd W and Bridgewater Karen E P
Bought by
Bridgewater Floyd W and Bridgewater Karen E P
Purchase Details
Closed on
Oct 27, 1998
Sold by
Coe Agnes
Bought by
Bridgewater Karen
Purchase Details
Closed on
May 31, 1996
Sold by
Heflen Pamela R and Thomas Pamela R
Bought by
Bridgewater Karen E P
Purchase Details
Closed on
Oct 27, 1994
Sold by
Coe E Wheeler
Bought by
Bridgewater Floyd W and Bridgewater Karen P
Purchase Details
Closed on
Oct 18, 1993
Sold by
Wilson Weylin K and Moore Cheryl M
Bought by
Coe Agnes
Purchase Details
Closed on
Sep 22, 1993
Sold by
Coe E Wheeler
Bought by
Coe Agnes
Create a Home Valuation Report for This Property
The Home Valuation Report is an in-depth analysis detailing your home's value as well as a comparison with similar homes in the area
Purchase History
| Date | Buyer | Sale Price | Title Company |
|---|---|---|---|
| Bermudez Carlos Mauricio | -- | Stewart Title | |
| Bridgewater Floyd W | -- | -- | |
| Bridgewater Floyd W | -- | -- | |
| Bridgewater Karen | -- | -- | |
| Bridgewater Karen E P | -- | American Title Company | |
| Bridgewater Floyd W | -- | Regency Title | |
| Coe Agnes | -- | Fidelity National Title Comp | |
| Coe Agnes | -- | Fidelity National Title Comp |
Source: Public Records
Tax History
| Year | Tax Paid | Tax Assessment Tax Assessment Total Assessment is a certain percentage of the fair market value that is determined by local assessors to be the total taxable value of land and additions on the property. | Land | Improvement |
|---|---|---|---|---|
| 2025 | $515 | $287,302 | -- | -- |
| 2024 | $515 | $261,184 | -- | -- |
| 2023 | $487 | $237,440 | $182,950 | $188,850 |
| 2022 | $3,809 | $215,850 | $246,470 | $127,710 |
| 2021 | $3,647 | $196,230 | $200,370 | $97,030 |
| 2020 | $3,610 | $178,390 | $200,370 | $97,030 |
| 2019 | $3,266 | $162,170 | $200,370 | $94,740 |
| 2018 | $1,910 | $147,430 | $87,120 | $99,180 |
| 2017 | $2,842 | $134,030 | $34,850 | $99,180 |
| 2016 | $2,664 | $125,630 | $34,850 | $99,180 |
| 2015 | $1,239 | $114,210 | $34,850 | $99,180 |
| 2014 | $1,239 | $103,830 | $34,850 | $103,640 |
Source: Public Records
Map
Nearby Homes
- 31307 Terri Ln
- 31306 E Timberloch Trail
- 31406 E Timberloch Trail
- 31218 Wide Oak Cir
- 31219 Wide Oak Cir
- 30935 Towering Oaks Dr
- 16407 Timberline Trail
- 31510 E Timberloch Trail
- 23618 Napa View Valley Dr
- 31302 W Timberloch Trail
- 30906 Walnut Creek Rd
- 23107 Rosewood Trail
- 24807 Springbluff Valley Ct
- 16107 Walnut Springs Ln
- 22911 Wren Ln
- 15863 Elegant Pine Ln
- 23902 Decker Prairie-Rosehill Rd
- 25822 Bridle Creek Dr N
- 15629 Knotty Oaks Trail
- 27663 Basswood Hollow Ln
- 15807 Coe Loop
- 15809 Coe Loop
- 15908 Coe Loop
- 15810 Coe Loop
- 31102 Debbi Ln
- 15706 Coe Loop
- 15912 Coe Loop
- 15915 Coe Loop
- 15911 Coe Loop
- 15923 Coe Loop
- 0 Debbie Unit 8686737
- 0 Debbie Unit 624892
- 0 Debbie Unit 7235223
- 000 Debbi
- 15702 Coe Loop
- 31110 Debbi Ln
- 15703 Coe Loop
- 16002 Coe Loop
- 30902 Kate Dr
- 15615 Coe Loop
Your Personal Tour Guide
Ask me questions while you tour the home.