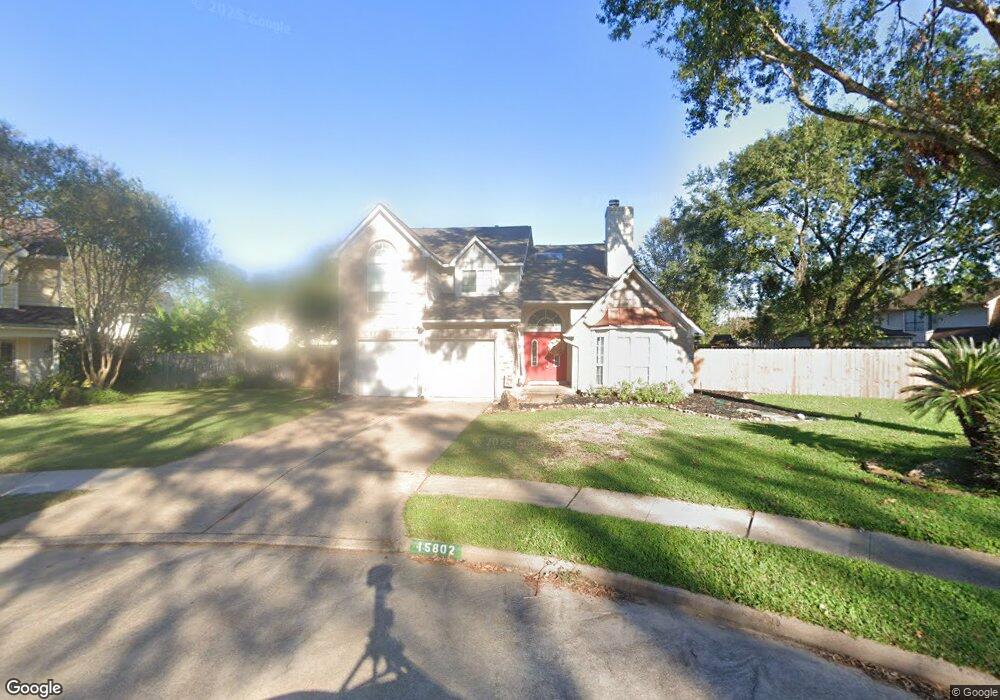
15802 Imperial Falls Ct Houston, TX 77095
Copperfield NeighborhoodEstimated Value: $294,000 - $319,565
3
Beds
3
Baths
2,224
Sq Ft
$138/Sq Ft
Est. Value
About This Home
This home is located at 15802 Imperial Falls Ct, Houston, TX 77095 and is currently estimated at $307,141, approximately $138 per square foot. 15802 Imperial Falls Ct is a home located in Harris County with nearby schools including Fiest Elementary School, Labay Middle School, and Cypress Falls High School.
Ownership History
Date
Name
Owned For
Owner Type
Purchase Details
Closed on
Jun 28, 2013
Sold by
Reed Clifford V
Bought by
Patrick John Wesley and Patrick Lindsay Werkhovefn
Current Estimated Value
Home Financials for this Owner
Home Financials are based on the most recent Mortgage that was taken out on this home.
Original Mortgage
$151,200
Outstanding Balance
$108,157
Interest Rate
3.54%
Mortgage Type
FHA
Estimated Equity
$198,984
Purchase Details
Closed on
Oct 15, 2004
Sold by
Profota Daniel J and Profota Sharon L
Bought by
Reed Clifford and Player Mary A
Home Financials for this Owner
Home Financials are based on the most recent Mortgage that was taken out on this home.
Original Mortgage
$90,000
Interest Rate
5.68%
Mortgage Type
Purchase Money Mortgage
Create a Home Valuation Report for This Property
The Home Valuation Report is an in-depth analysis detailing your home's value as well as a comparison with similar homes in the area
Home Values in the Area
Average Home Value in this Area
Purchase History
| Date | Buyer | Sale Price | Title Company |
|---|---|---|---|
| Patrick John Wesley | -- | None Available | |
| Reed Clifford | -- | First American Title |
Source: Public Records
Mortgage History
| Date | Status | Borrower | Loan Amount |
|---|---|---|---|
| Open | Patrick John Wesley | $151,200 | |
| Previous Owner | Reed Clifford | $90,000 |
Source: Public Records
Tax History Compared to Growth
Tax History
| Year | Tax Paid | Tax Assessment Tax Assessment Total Assessment is a certain percentage of the fair market value that is determined by local assessors to be the total taxable value of land and additions on the property. | Land | Improvement |
|---|---|---|---|---|
| 2025 | $3,690 | $286,434 | $78,346 | $208,088 |
| 2024 | $3,690 | $282,928 | $70,020 | $212,908 |
| 2023 | $3,690 | $293,405 | $70,020 | $223,385 |
| 2022 | $5,379 | $275,917 | $53,745 | $222,172 |
| 2021 | $5,152 | $221,923 | $53,745 | $168,178 |
| 2020 | $5,073 | $212,737 | $44,661 | $168,076 |
| 2019 | $4,969 | $201,328 | $35,199 | $166,129 |
| 2018 | $1,846 | $191,467 | $35,199 | $156,268 |
| 2017 | $4,392 | $191,467 | $35,199 | $156,268 |
| 2016 | $4,392 | $191,467 | $35,199 | $156,268 |
| 2015 | $3,862 | $184,531 | $35,199 | $149,332 |
| 2014 | $3,862 | $160,731 | $29,522 | $131,209 |
Source: Public Records
Map
Nearby Homes
- 8203 Green Devon Dr
- 15918 Pinyon Creek Dr
- 8526 Hot Springs Dr
- 8306 Lake Crystal Dr
- 8211 Riverglade Dr
- 15611 Meadow Village Dr
- 15954 Oak Mountain Dr
- 15854 Knolls Lodge Dr
- 8526 Greenleaf Lake Dr
- 15339 Glenwood Park Dr
- 8550 Sparkling Springs Dr
- 16026 Autumn Falls Ln
- 8426 Laurel Trails Dr
- 16114 Kintyre Point Rd
- 15735 Jamie Lee Dr
- 16030 Royal Garden Dr
- 16215 Wemyss Bay Rd
- 15415 Swan Creek Dr
- 15634 Haleys Landing Ln
- 15414 Swan Creek Dr
- 8310 Silver Bay Ct
- 15806 Imperial Falls Ct
- 15803 Imperial Falls Ct
- 15807 Maple Manor Dr
- 15803 Maple Manor Dr
- 8307 Silver Bay Ct
- 15811 Maple Manor Dr
- 15739 Maple Manor Dr
- 15810 Imperial Falls Ct
- 15807 Imperial Falls Ct
- 15815 Maple Manor Dr
- 8306 Silver Bay Ct
- 15735 Maple Manor Dr
- 8303 Silver Bay Ct
- 8310 Plum Lake Dr
- 15806 Maple Manor Dr
- 15819 Maple Manor Dr
- 15802 Maple Manor Dr
- 8303 Plum Lake Dr
- 15810 Maple Manor Dr