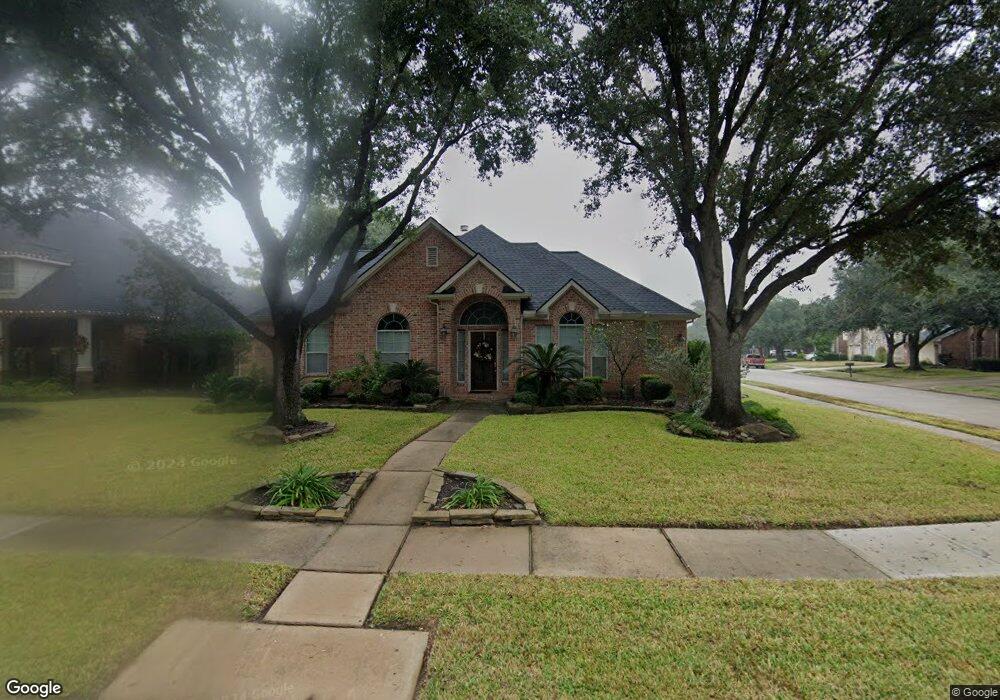
15802 Stenbury Ct Cypress, TX 77429
Estimated Value: $404,146 - $474,000
4
Beds
2
Baths
2,752
Sq Ft
$158/Sq Ft
Est. Value
About This Home
This home is located at 15802 Stenbury Ct, Cypress, TX 77429 and is currently estimated at $435,537, approximately $158 per square foot. 15802 Stenbury Ct is a home located in Harris County with nearby schools including Sampson Elementary School, Spillane Middle School, and Cypress Woods High School.
Ownership History
Date
Name
Owned For
Owner Type
Purchase Details
Closed on
Jul 26, 2017
Sold by
Nguyen Khuyen Thi and Khuong Tuoi Thi
Bought by
Khuong Tuoi Thi and Nguyen Tuoi Thi
Current Estimated Value
Purchase Details
Closed on
Dec 27, 2007
Sold by
Primacy Closing Corp
Bought by
Khuong Ngoc M and Khuong Tuoi T
Home Financials for this Owner
Home Financials are based on the most recent Mortgage that was taken out on this home.
Original Mortgage
$152,600
Interest Rate
6.26%
Mortgage Type
Purchase Money Mortgage
Purchase Details
Closed on
Jun 27, 2007
Sold by
Curtis Michael C and Curtis Sonia
Bought by
Primacy Closing Corp
Purchase Details
Closed on
Jun 24, 2003
Sold by
Mhi Partnership Ltd
Bought by
Curtis Michael C
Home Financials for this Owner
Home Financials are based on the most recent Mortgage that was taken out on this home.
Original Mortgage
$34,349
Interest Rate
5.23%
Mortgage Type
Unknown
Create a Home Valuation Report for This Property
The Home Valuation Report is an in-depth analysis detailing your home's value as well as a comparison with similar homes in the area
Home Values in the Area
Average Home Value in this Area
Purchase History
| Date | Buyer | Sale Price | Title Company |
|---|---|---|---|
| Khuong Tuoi Thi | -- | None Available | |
| Khuong Ngoc M | -- | Stewart Title Houston Div | |
| Primacy Closing Corp | -- | Stewart Title Houston Div | |
| Curtis Michael C | -- | Millennium Title Houston |
Source: Public Records
Mortgage History
| Date | Status | Borrower | Loan Amount |
|---|---|---|---|
| Previous Owner | Khuong Ngoc M | $152,600 | |
| Previous Owner | Curtis Michael C | $34,349 | |
| Previous Owner | Curtis Michael C | $183,196 |
Source: Public Records
Tax History Compared to Growth
Tax History
| Year | Tax Paid | Tax Assessment Tax Assessment Total Assessment is a certain percentage of the fair market value that is determined by local assessors to be the total taxable value of land and additions on the property. | Land | Improvement |
|---|---|---|---|---|
| 2025 | $5,893 | $403,914 | $102,845 | $301,069 |
| 2024 | $5,893 | $382,192 | $93,536 | $288,656 |
| 2023 | $5,893 | $416,245 | $93,536 | $322,709 |
| 2022 | $7,517 | $379,916 | $66,938 | $312,978 |
| 2021 | $7,258 | $286,762 | $66,938 | $219,824 |
| 2020 | $6,906 | $264,667 | $49,169 | $215,498 |
| 2019 | $6,844 | $254,348 | $49,169 | $205,179 |
| 2018 | $2,519 | $249,946 | $49,169 | $200,777 |
| 2017 | $7,050 | $261,967 | $49,169 | $212,798 |
| 2016 | $7,700 | $286,100 | $49,169 | $236,931 |
| 2015 | $3,837 | $299,315 | $49,169 | $250,146 |
| 2014 | $3,837 | $266,249 | $49,169 | $217,080 |
Source: Public Records
Map
Nearby Homes
- 13718 Sherburn Manor Dr
- 15923 Hurstfield Pointe Dr
- 14103 Sherburn Manor Dr
- 14210 Prospect Point Dr
- 14314 Prosper Ridge Dr
- 13002 Huffmeister Rd
- 13014 Vivienne Westmoreland Dr
- 16219 Haden Crest Ct
- 13611 Monteigne Ln
- 16306 Bontura St
- 14442 Gleaming Rose Dr
- 16211 Halpren Falls Ln
- 15803 Stiller Park Dr
- 15922 Clipper Pointe Dr
- 13926 Wessex Park Dr
- 13703 Layton Hills Dr
- 16322 Bontura St
- 14126 Bloomingdale Manor Dr
- 14539 Gleaming Rose Dr
- 16406 Haden Crest Ct
- 15806 Stenbury Ct
- 15803 Linwood Manor Ct
- 15810 Stenbury Ct
- 15807 Linwood Manor Ct
- 13806 Bowden Creek Dr
- 13802 Bowden Creek Dr
- 15811 Linwood Manor Ct
- 13810 Bowden Creek Dr
- 15803 Stenbury Ct
- 15814 Stenbury Ct
- 15807 Stenbury Ct
- 13730 Bowden Creek Dr
- 15811 Stenbury Ct
- 15815 Linwood Manor Ct
- 13814 Bowden Creek Dr
- 15818 Stenbury Ct
- 13726 Bowden Creek Dr
- 15815 Stenbury Ct
- 15819 Linwood Manor Ct
- 13818 Bowden Creek Dr