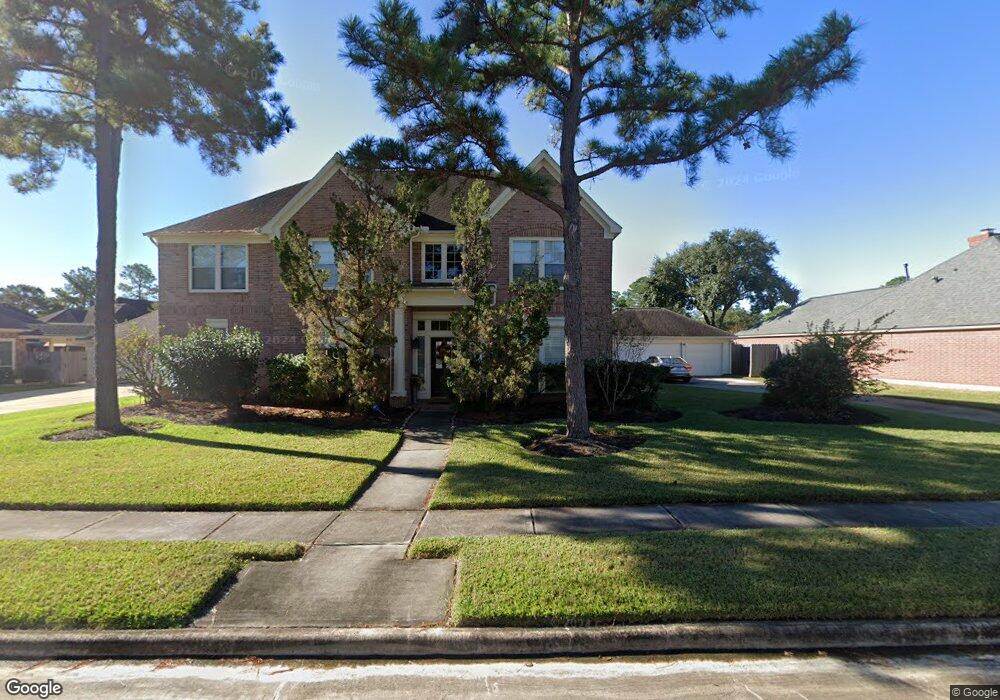
15803 Cascading Brook Way Cypress, TX 77433
Fairfield Village NeighborhoodEstimated Value: $568,000 - $605,260
5
Beds
5
Baths
4,024
Sq Ft
$146/Sq Ft
Est. Value
About This Home
This home is located at 15803 Cascading Brook Way, Cypress, TX 77433 and is currently estimated at $588,315, approximately $146 per square foot. 15803 Cascading Brook Way is a home located in Harris County with nearby schools including Ault Elementary School, Salyards Middle, and Bridgeland High School.
Ownership History
Date
Name
Owned For
Owner Type
Purchase Details
Closed on
Nov 24, 1998
Sold by
Ianarelli Robert J and Ianarelli Delores J
Bought by
Savage Brent A and Savage Leanne A
Current Estimated Value
Home Financials for this Owner
Home Financials are based on the most recent Mortgage that was taken out on this home.
Original Mortgage
$176,000
Interest Rate
6.66%
Purchase Details
Closed on
Jan 23, 1996
Sold by
Campbell Steve and Martinez Nilda
Bought by
Ianarelli Robert J and Ianarelli Delores J
Home Financials for this Owner
Home Financials are based on the most recent Mortgage that was taken out on this home.
Original Mortgage
$136,000
Interest Rate
6.92%
Mortgage Type
Balloon
Purchase Details
Closed on
Oct 25, 1994
Sold by
Perry Homes
Bought by
Campbell Steve and Martinez Nilda
Home Financials for this Owner
Home Financials are based on the most recent Mortgage that was taken out on this home.
Original Mortgage
$96,950
Interest Rate
7.62%
Purchase Details
Closed on
Feb 3, 1994
Sold by
Friendswood Development Company
Bought by
Perry Homes
Create a Home Valuation Report for This Property
The Home Valuation Report is an in-depth analysis detailing your home's value as well as a comparison with similar homes in the area
Home Values in the Area
Average Home Value in this Area
Purchase History
| Date | Buyer | Sale Price | Title Company |
|---|---|---|---|
| Savage Brent A | -- | Chicago Title | |
| Ianarelli Robert J | -- | First American Title | |
| Campbell Steve | -- | Citizens Title Company | |
| Perry Homes | -- | Citizens Title Company |
Source: Public Records
Mortgage History
| Date | Status | Borrower | Loan Amount |
|---|---|---|---|
| Previous Owner | Savage Brent A | $176,000 | |
| Previous Owner | Ianarelli Robert J | $136,000 | |
| Previous Owner | Campbell Steve | $96,950 |
Source: Public Records
Tax History Compared to Growth
Tax History
| Year | Tax Paid | Tax Assessment Tax Assessment Total Assessment is a certain percentage of the fair market value that is determined by local assessors to be the total taxable value of land and additions on the property. | Land | Improvement |
|---|---|---|---|---|
| 2025 | $7,895 | $592,882 | $106,808 | $486,074 |
| 2024 | $7,895 | $521,313 | $89,196 | $432,117 |
| 2023 | $7,895 | $437,029 | $89,196 | $347,833 |
| 2022 | $9,729 | $464,360 | $74,425 | $389,935 |
| 2021 | $9,362 | $349,850 | $74,425 | $275,425 |
| 2020 | $9,365 | $336,973 | $46,587 | $290,386 |
| 2019 | $9,725 | $338,759 | $45,450 | $293,309 |
| 2018 | $3,444 | $330,214 | $45,450 | $284,764 |
| 2017 | $9,663 | $330,214 | $45,450 | $284,764 |
| 2016 | $9,663 | $330,214 | $45,450 | $284,764 |
| 2015 | $7,007 | $313,058 | $45,450 | $267,608 |
| 2014 | $7,007 | $288,685 | $45,450 | $243,235 |
Source: Public Records
Map
Nearby Homes
- 20806 Autumn Redwood Way
- 15434 Redbud Leaf Ln
- 15611 Garden Bend Cir
- 20822 Chappell Knoll Dr
- 15618 Meadow Palm Dr
- 20418 Scenic Woods Dr
- 20434 Willow Trace Dr
- 15403 Redbud Leaf Ln
- 20411 Garden Falls Ct
- 21127 Dolphin Bay Ln
- 20739 Maple Village Dr
- 19927 Maple Village Dr
- 15918 Lake Loop Dr
- 15003 Big Spring Park Dr
- 16018 Lower Lake Dr
- 15314 Rocky Bridge Ln
- 20331 Lone Star Oak St
- 20207 Fairfield Trace Dr
- 15002 Vista Heights Dr
- 15010 Vista Heights Dr
- 15723 Cascading Brook Way
- 15630 Twisting Springs Dr
- 15626 Twisting Springs Dr
- 15802 Cascading Brook Way
- 15702 Twisting Springs Dr
- 15726 Cascading Brook Way
- 15806 Cascading Brook Way
- 15811 Cascading Brook Way
- 15719 Cascading Brook Way
- 15622 Twisting Springs Dr
- 15722 Cascading Brook Way
- 15810 Cascading Brook Way
- 15706 Twisting Springs Dr
- 15807 Township Glen Ln
- 15627 Twisting Springs Dr
- 15627 Twisting Springs Dr Unit ID1019641P
- 15811 Township Glen Ln
- 15703 Twisting Springs Dr
- 15815 Cascading Brook Way
- 15715 Cascading Brook Way