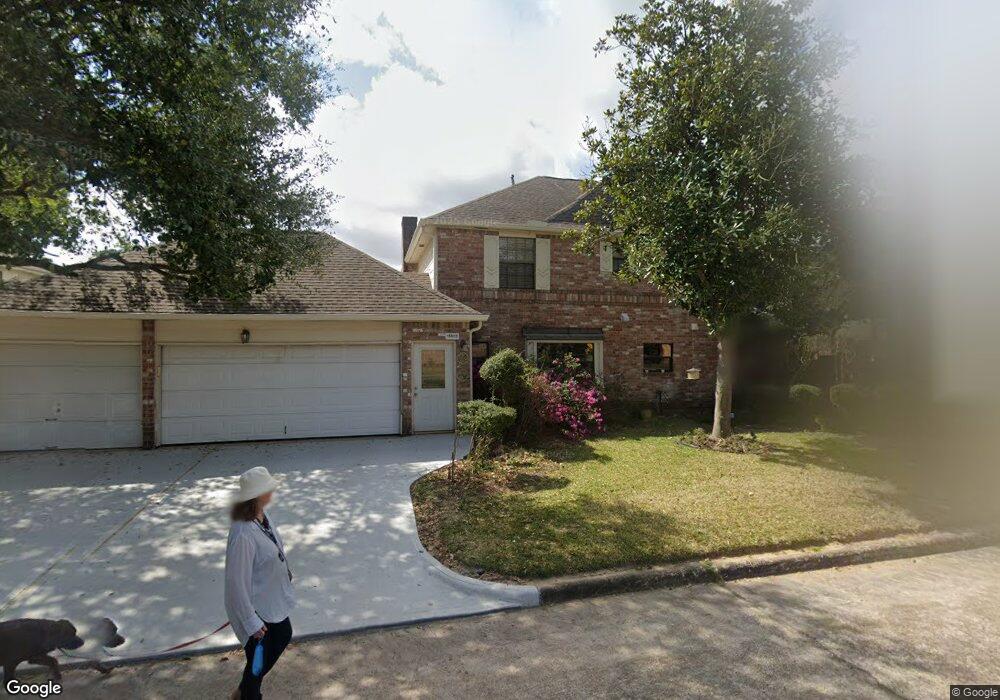
15803 S Barkers Landing Rd Houston, TX 77079
Energy Corridor NeighborhoodEstimated Value: $702,216 - $769,000
4
Beds
4
Baths
3,207
Sq Ft
$226/Sq Ft
Est. Value
About This Home
This home is located at 15803 S Barkers Landing Rd, Houston, TX 77079 and is currently estimated at $726,304, approximately $226 per square foot. 15803 S Barkers Landing Rd is a home located in Harris County with nearby schools including Maurice L. Wolfe Elementary School, Memorial Parkway Junior High School, and James E. Taylor High School.
Ownership History
Date
Name
Owned For
Owner Type
Purchase Details
Closed on
Jul 22, 2004
Sold by
Mohammadi Nazanin A
Bought by
Mohammadi Ziaeddin
Current Estimated Value
Purchase Details
Closed on
Jul 27, 2001
Sold by
Soheili Ziba and Soheili Mehdi
Bought by
Sabri Parviz
Purchase Details
Closed on
Mar 22, 1996
Sold by
Bank United Of Texas Fsb
Bought by
Mohammadi Zialddin and Mohammadi Nazanin
Home Financials for this Owner
Home Financials are based on the most recent Mortgage that was taken out on this home.
Original Mortgage
$145,200
Interest Rate
6.92%
Purchase Details
Closed on
May 2, 1995
Sold by
Vargas Carlos Duran and Deduran Martha Sanchez
Bought by
Bank United Of Texas Fsb
Create a Home Valuation Report for This Property
The Home Valuation Report is an in-depth analysis detailing your home's value as well as a comparison with similar homes in the area
Home Values in the Area
Average Home Value in this Area
Purchase History
| Date | Buyer | Sale Price | Title Company |
|---|---|---|---|
| Mohammadi Ziaeddin | -- | None Available | |
| Sabri Parviz | -- | -- | |
| Mohammadi Zialddin | -- | Fidelity National Title | |
| Bank United Of Texas Fsb | $14,620 | -- |
Source: Public Records
Mortgage History
| Date | Status | Borrower | Loan Amount |
|---|---|---|---|
| Previous Owner | Mohammadi Zialddin | $145,200 | |
| Closed | Mohammadi Ziaeddin | $0 |
Source: Public Records
Tax History Compared to Growth
Tax History
| Year | Tax Paid | Tax Assessment Tax Assessment Total Assessment is a certain percentage of the fair market value that is determined by local assessors to be the total taxable value of land and additions on the property. | Land | Improvement |
|---|---|---|---|---|
| 2025 | $7,934 | $698,763 | $150,008 | $548,755 |
| 2024 | $7,934 | $704,300 | $106,362 | $597,938 |
| 2023 | $7,934 | $659,105 | $106,362 | $552,743 |
| 2022 | $14,783 | $627,541 | $93,225 | $534,316 |
| 2021 | $14,090 | $566,122 | $93,225 | $472,897 |
| 2020 | $15,391 | $585,709 | $93,225 | $492,484 |
| 2019 | $15,283 | $557,746 | $81,360 | $476,386 |
| 2018 | $13,091 | $557,746 | $81,360 | $476,386 |
| 2017 | $12,835 | $522,425 | $81,360 | $441,065 |
| 2016 | $11,669 | $522,425 | $81,360 | $441,065 |
| 2015 | $8,717 | $522,425 | $81,360 | $441,065 |
| 2014 | $8,717 | $442,794 | $81,360 | $361,434 |
Source: Public Records
Map
Nearby Homes
- 507 Anchorage Ln
- 15707 Steamboat Ln
- 426 E Fair Harbor Ln
- 15715 Whitewater Ln
- 15686 Barkers Landing Rd
- 618 Sandy Port St
- 15651 Whitewater Ln
- 15910 S Barkers Landing Rd
- 409 E Fair Harbor Ln
- 502 Lee Shore Ln
- 502 Barkers Cove
- 15702 Fleetwood Oaks Dr
- 15600 Barkers Landing Rd Unit 20
- 707 Queensmill Ct
- 522 Timber Cir
- Gianna Plan at Retreat at Oak Park
- Bermuda Plan at Retreat at Oak Park
- 16045 Hayes Park Dr
- Artista Plan at Retreat at Oak Park
- 16046 Mason Run Dr
- 15807 S Barkers Landing Rd
- 502 Commodore Way
- 506 Commodore Way
- 15811 S Barkers Landing Rd
- 15802 S Barkers Landing Rd
- 15810 S Barkers Landing Rd
- 15806 N Barkers Landing Rd
- 418 Commodore Way
- 503 Sandy Port St
- 15814 S Barkers Landing Rd
- 419 Sandy Bluff
- 514 Commodore Way
- 414 Commodore Way
- 507 Commodore Way
- 507 Sandy Port St
- 15750 Barkers Landing Rd
- 506 Sandy Port St
- 15811 N Barkers Landing Rd
- 15818 S Barkers Landing Rd
- 511 Commodore Way