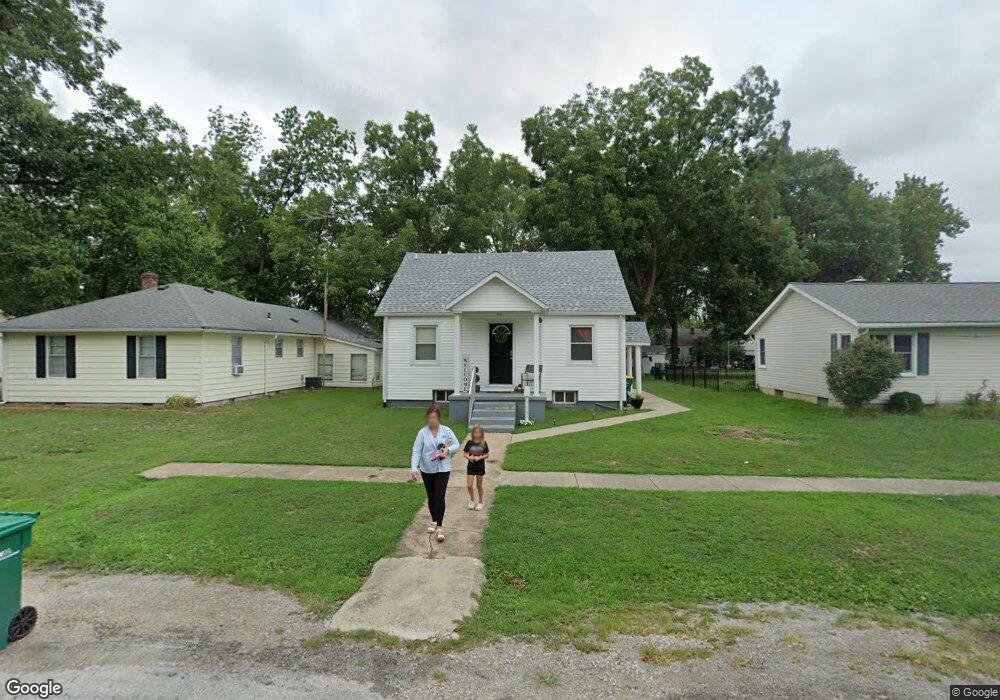
1581 Clinton St Carlyle, IL 62231
Estimated Value: $126,000 - $153,000
3
Beds
2
Baths
1,526
Sq Ft
$93/Sq Ft
Est. Value
About This Home
This home is located at 1581 Clinton St, Carlyle, IL 62231 and is currently estimated at $141,163, approximately $92 per square foot. 1581 Clinton St is a home located in Clinton County with nearby schools including Carlyle Elementary School, Carlyle Junior High School, and Carlyle High School.
Ownership History
Date
Name
Owned For
Owner Type
Purchase Details
Closed on
Jun 12, 2020
Sold by
Anderson Bryan M
Bought by
Reynolds Michael L and Reynolds Whitney R
Current Estimated Value
Home Financials for this Owner
Home Financials are based on the most recent Mortgage that was taken out on this home.
Original Mortgage
$111,111
Outstanding Balance
$98,583
Interest Rate
3.25%
Mortgage Type
New Conventional
Estimated Equity
$42,580
Purchase Details
Closed on
Mar 4, 2009
Sold by
Schaefer Heath M and Schaefer Rachel M
Bought by
Schaefer Rachel M
Purchase Details
Closed on
Jul 15, 2005
Sold by
Schadegg Barry F and Schadegg Lisa A
Bought by
Schaefer Heath M and Schaefer Rachel M
Home Financials for this Owner
Home Financials are based on the most recent Mortgage that was taken out on this home.
Original Mortgage
$89,230
Interest Rate
5.69%
Mortgage Type
USDA
Create a Home Valuation Report for This Property
The Home Valuation Report is an in-depth analysis detailing your home's value as well as a comparison with similar homes in the area
Home Values in the Area
Average Home Value in this Area
Purchase History
| Date | Buyer | Sale Price | Title Company |
|---|---|---|---|
| Reynolds Michael L | $110,000 | None Available | |
| Schaefer Rachel M | -- | None Available | |
| Schaefer Heath M | $88,500 | None Available |
Source: Public Records
Mortgage History
| Date | Status | Borrower | Loan Amount |
|---|---|---|---|
| Open | Reynolds Michael L | $111,111 | |
| Previous Owner | Schaefer Heath M | $89,230 |
Source: Public Records
Tax History Compared to Growth
Tax History
| Year | Tax Paid | Tax Assessment Tax Assessment Total Assessment is a certain percentage of the fair market value that is determined by local assessors to be the total taxable value of land and additions on the property. | Land | Improvement |
|---|---|---|---|---|
| 2024 | $1,949 | $36,550 | $3,590 | $32,960 |
| 2023 | $1,949 | $33,220 | $3,260 | $29,960 |
| 2022 | $1,794 | $28,640 | $3,360 | $25,280 |
| 2021 | $1,496 | $27,800 | $3,260 | $24,540 |
| 2020 | $1,925 | $27,800 | $3,260 | $24,540 |
| 2019 | $1,487 | $27,800 | $3,260 | $24,540 |
| 2018 | $1,845 | $31,240 | $3,293 | $27,947 |
| 2017 | $1,851 | $30,930 | $3,260 | $27,670 |
| 2016 | $1,836 | $30,930 | $3,260 | $27,670 |
| 2015 | $1,968 | $30,930 | $3,260 | $27,670 |
| 2013 | $1,968 | $32,930 | $3,260 | $29,670 |
Source: Public Records
Map
Nearby Homes
- 1090 18th St
- 1870 Fairfax St
- 951 10th St
- 611 23rd St
- 15207 Business Highway 127
- 471 Methodist St
- 16743 Ashland Ct
- 15556 Old State Rd
- 3 Lakeview Dr
- 18835 Mary Jane Ln
- 291 Carter St
- 0 Redwood St
- 18018 Illinois 127
- 22000 East Rd
- 21065 Illinois 161
- 10675 Buckingham Ct
- 126 Jefferson Dr
- 1102 Cherry St
- 6908 Bassen Rd
- 13898 Lincoln Dr
- 1591 Clinton St
- 1551 Clinton St
- 1590 Clinton St
- 1531 Clinton St
- 1570 Clinton St
- 1611 Clinton St
- 1511 Clinton St
- 1570 Mulliken St
- 1590 Mulliken St
- 1550 Clinton St
- 1510 Clinton St
- 1550 Mulliken St
- 1631 Clinton St
- 1610 Clinton St
- 1610 Mulliken St
- 1651 Clinton St
- 1530 Mulliken St
- 1650 Clinton St
- 831 16th St
- 1510 Mulliken St