1581 Highway 48 N Durant, OK 74701
Estimated Value: $364,946 - $500,000
4
Beds
2
Baths
2,480
Sq Ft
$173/Sq Ft
Est. Value
About This Home
This home is located at 1581 Highway 48 N, Durant, OK 74701 and is currently estimated at $428,987, approximately $172 per square foot. 1581 Highway 48 N is a home located in Bryan County with nearby schools including Silo Early Childhood Center, Silo Elementary School, and Silo Middle School.
Ownership History
Date
Name
Owned For
Owner Type
Purchase Details
Closed on
Mar 15, 2013
Sold by
Faris Kevin Jay and Faris Debra H
Bought by
Barnes Al Creston and Barnes Patricia A
Current Estimated Value
Home Financials for this Owner
Home Financials are based on the most recent Mortgage that was taken out on this home.
Original Mortgage
$237,590
Outstanding Balance
$167,889
Interest Rate
3.57%
Mortgage Type
VA
Estimated Equity
$261,098
Purchase Details
Closed on
Nov 10, 2011
Sold by
Slawson Ronald E and Slawson Paula C
Bought by
Faris Kevin Jay and Faris Debra H
Home Financials for this Owner
Home Financials are based on the most recent Mortgage that was taken out on this home.
Original Mortgage
$219,296
Interest Rate
4.25%
Mortgage Type
FHA
Purchase Details
Closed on
Jun 14, 2000
Sold by
Penner Sandy and Penner Debra J
Bought by
Slawson Ronald and Slawson Paula
Purchase Details
Closed on
Nov 15, 1999
Sold by
Forbis Gary and Forbis Shirley
Bought by
Penner Sandy and Penner Debra J
Create a Home Valuation Report for This Property
The Home Valuation Report is an in-depth analysis detailing your home's value as well as a comparison with similar homes in the area
Home Values in the Area
Average Home Value in this Area
Purchase History
| Date | Buyer | Sale Price | Title Company |
|---|---|---|---|
| Barnes Al Creston | $230,000 | None Available | |
| Faris Kevin Jay | $225,000 | None Available | |
| Slawson Ronald | $145,000 | -- | |
| Penner Sandy | $135,000 | -- |
Source: Public Records
Mortgage History
| Date | Status | Borrower | Loan Amount |
|---|---|---|---|
| Open | Barnes Al Creston | $237,590 | |
| Previous Owner | Faris Kevin Jay | $219,296 |
Source: Public Records
Tax History Compared to Growth
Tax History
| Year | Tax Paid | Tax Assessment Tax Assessment Total Assessment is a certain percentage of the fair market value that is determined by local assessors to be the total taxable value of land and additions on the property. | Land | Improvement |
|---|---|---|---|---|
| 2024 | $2,243 | $27,507 | $5,500 | $22,007 |
| 2023 | $2,243 | $27,523 | $5,500 | $22,023 |
| 2022 | $2,246 | $27,523 | $5,500 | $22,023 |
| 2021 | $2,151 | $27,045 | $5,399 | $21,646 |
| 2020 | $2,097 | $26,258 | $5,232 | $21,026 |
| 2019 | $2,065 | $25,492 | $5,069 | $20,423 |
| 2018 | $2,011 | $24,750 | $3,388 | $21,362 |
| 2017 | $1,749 | $24,750 | $3,388 | $21,362 |
| 2016 | $1,749 | $24,750 | $3,388 | $21,362 |
| 2015 | $1,749 | $24,750 | $3,869 | $20,881 |
| 2014 | $1,748 | $24,750 | $3,869 | $20,881 |
Source: Public Records
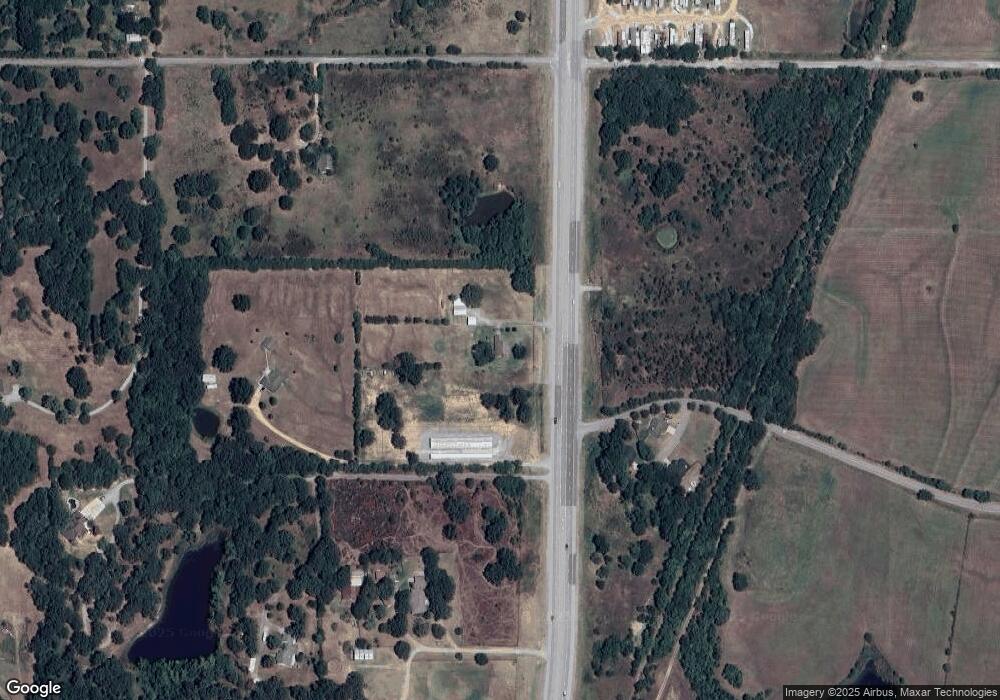
Map
Nearby Homes
- 19 Skylark Ln
- 236 Grove Way
- 959 Knight Dr
- 00 Sandstone
- 0 Sand Trap Dr
- 18 Sandwedge
- 19 Blake Ln
- 20 Blake Ln
- 129 Highland Dr
- 001 Knight Dr
- 203 Red Oak Dr
- 5301 Stonebriar Cir
- 5616 Stonecreek Dr
- 5353 Stonebriar Cir
- 409 Roadrunner Dr
- 5211 Roadrunner Dr
- 1425 Folsom Rd
- 5205 Pheasant Run
- 157 Lake Meadow Loop Rd
- 5428 Roadrunner Dr