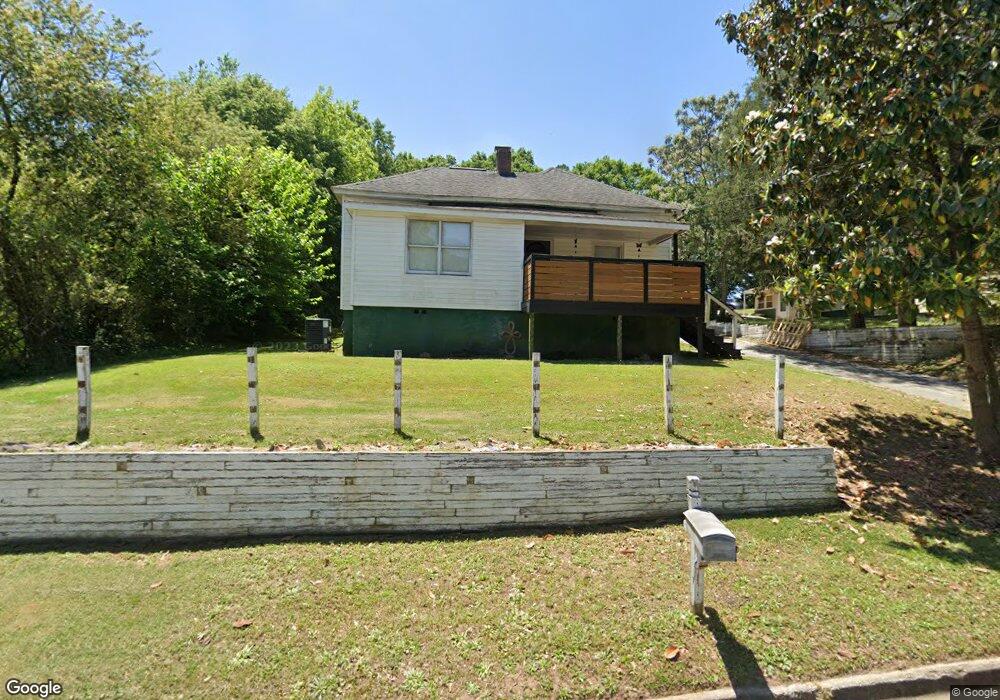
1581 Park St NE Conyers, GA 30012
Estimated Value: $147,000 - $177,000
2
Beds
1
Bath
1,044
Sq Ft
$159/Sq Ft
Est. Value
About This Home
This home is located at 1581 Park St NE, Conyers, GA 30012 and is currently estimated at $165,633, approximately $158 per square foot. 1581 Park St NE is a home located in Rockdale County with nearby schools including Hightower Trail Elementary School, Conyers Middle School, and Rockdale County High School.
Ownership History
Date
Name
Owned For
Owner Type
Purchase Details
Closed on
Jan 10, 2020
Sold by
Pineda Jose P
Bought by
Williams Devin M
Current Estimated Value
Home Financials for this Owner
Home Financials are based on the most recent Mortgage that was taken out on this home.
Original Mortgage
$69,190
Outstanding Balance
$61,285
Interest Rate
3.73%
Mortgage Type
New Conventional
Estimated Equity
$104,348
Purchase Details
Closed on
Jul 19, 2005
Sold by
Hawkins Jerry R
Bought by
Pineda Jose P and Pineda Leticia
Home Financials for this Owner
Home Financials are based on the most recent Mortgage that was taken out on this home.
Original Mortgage
$50,000
Interest Rate
5.46%
Mortgage Type
New Conventional
Purchase Details
Closed on
Jul 14, 2005
Sold by
Hawkins Cristina P
Bought by
Hawkins Jerrye R
Home Financials for this Owner
Home Financials are based on the most recent Mortgage that was taken out on this home.
Original Mortgage
$50,000
Interest Rate
5.46%
Mortgage Type
New Conventional
Create a Home Valuation Report for This Property
The Home Valuation Report is an in-depth analysis detailing your home's value as well as a comparison with similar homes in the area
Home Values in the Area
Average Home Value in this Area
Purchase History
| Date | Buyer | Sale Price | Title Company |
|---|---|---|---|
| Williams Devin M | $68,000 | -- | |
| Pineda Jose P | $56,000 | -- | |
| Hawkins Jerrye R | -- | -- |
Source: Public Records
Mortgage History
| Date | Status | Borrower | Loan Amount |
|---|---|---|---|
| Open | Williams Devin M | $69,190 | |
| Previous Owner | Pineda Jose P | $50,000 |
Source: Public Records
Tax History Compared to Growth
Tax History
| Year | Tax Paid | Tax Assessment Tax Assessment Total Assessment is a certain percentage of the fair market value that is determined by local assessors to be the total taxable value of land and additions on the property. | Land | Improvement |
|---|---|---|---|---|
| 2024 | $1,159 | $53,400 | $13,400 | $40,000 |
| 2023 | $996 | $48,400 | $14,000 | $34,400 |
| 2022 | $706 | $37,120 | $9,440 | $27,680 |
| 2021 | $963 | $21,240 | $4,000 | $17,240 |
| 2020 | $771 | $17,520 | $4,400 | $13,120 |
| 2019 | $757 | $16,320 | $3,200 | $13,120 |
| 2018 | $742 | $15,920 | $3,200 | $12,720 |
| 2017 | $634 | $13,400 | $3,200 | $10,200 |
| 2016 | $530 | $11,120 | $3,600 | $7,520 |
| 2015 | $595 | $12,520 | $4,000 | $8,520 |
| 2014 | $490 | $10,120 | $3,400 | $6,720 |
| 2013 | -- | $16,680 | $4,000 | $12,680 |
Source: Public Records
Map
Nearby Homes
- 1573 Park St NE
- 1589 Park St NE
- 1565 Park St NE
- 1597 Park St NE
- 1597 Park St NE
- 1582 Park St NE
- 1598 Park St NE
- 1557 Park St NE
- 1590 Park St NE
- 1605 Park St NE
- 1555 Park St NE
- 1606 Park St NE
- 1553 Park St NE
- 1610 Park St NE
- 1551 Park St NE
- 1585 Church St NE
- 1612 Milstead Rd NE Unit B
- 1612 Milstead Rd NE
- 1616 Park St NE
- 1589 Church St NE