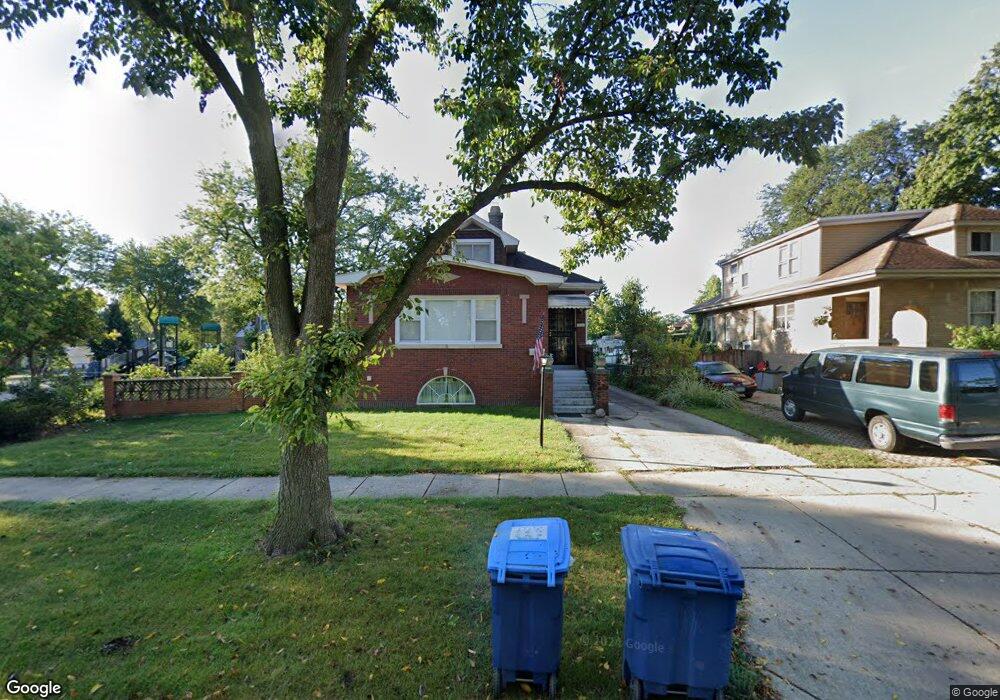
1581 Van Buren Ave Des Plaines, IL 60018
Estimated Value: $358,000 - $506,000
4
Beds
3
Baths
1,270
Sq Ft
$348/Sq Ft
Est. Value
About This Home
This home is located at 1581 Van Buren Ave, Des Plaines, IL 60018 and is currently estimated at $441,568, approximately $347 per square foot. 1581 Van Buren Ave is a home located in Cook County with nearby schools including Central Elementary School, Chippewa Middle School, and Maine West High School.
Ownership History
Date
Name
Owned For
Owner Type
Purchase Details
Closed on
Apr 30, 2025
Sold by
Karp Ryan Gaither and Karp Jessica Hollingsheed
Bought by
Baumhart Robert Mathias
Current Estimated Value
Home Financials for this Owner
Home Financials are based on the most recent Mortgage that was taken out on this home.
Original Mortgage
$446,500
Outstanding Balance
$444,834
Interest Rate
6.38%
Mortgage Type
New Conventional
Estimated Equity
-$3,266
Purchase Details
Closed on
May 25, 2017
Sold by
Declaration Veremis Georgia A
Bought by
Karp Ryan Gaither and Karp Jessica Hollingshead
Home Financials for this Owner
Home Financials are based on the most recent Mortgage that was taken out on this home.
Original Mortgage
$187,200
Interest Rate
4.02%
Mortgage Type
Construction
Purchase Details
Closed on
Jan 6, 2005
Sold by
Veremis Georgia A
Bought by
Declaration Veremis Georgia A and Georgia A Veremis Declaration Of Trust
Create a Home Valuation Report for This Property
The Home Valuation Report is an in-depth analysis detailing your home's value as well as a comparison with similar homes in the area
Home Values in the Area
Average Home Value in this Area
Purchase History
| Date | Buyer | Sale Price | Title Company |
|---|---|---|---|
| Baumhart Robert Mathias | $470,000 | Proper Title | |
| Karp Ryan Gaither | $234,000 | None Available | |
| Declaration Veremis Georgia A | -- | -- |
Source: Public Records
Mortgage History
| Date | Status | Borrower | Loan Amount |
|---|---|---|---|
| Open | Baumhart Robert Mathias | $446,500 | |
| Previous Owner | Karp Ryan Gaither | $187,200 |
Source: Public Records
Tax History Compared to Growth
Tax History
| Year | Tax Paid | Tax Assessment Tax Assessment Total Assessment is a certain percentage of the fair market value that is determined by local assessors to be the total taxable value of land and additions on the property. | Land | Improvement |
|---|---|---|---|---|
| 2024 | $7,827 | $30,039 | $8,208 | $21,831 |
| 2023 | $7,611 | $33,000 | $8,208 | $24,792 |
| 2022 | $7,611 | $33,000 | $8,208 | $24,792 |
| 2021 | $5,504 | $21,236 | $6,669 | $14,567 |
| 2020 | $5,480 | $21,236 | $6,669 | $14,567 |
| 2019 | $5,427 | $23,596 | $6,669 | $16,927 |
| 2018 | $4,805 | $19,501 | $5,899 | $13,602 |
| 2017 | $1,001 | $19,501 | $5,899 | $13,602 |
| 2016 | $1,596 | $19,501 | $5,899 | $13,602 |
| 2015 | $1,823 | $19,248 | $5,130 | $14,118 |
| 2014 | $5,696 | $19,248 | $5,130 | $14,118 |
| 2013 | $1,745 | $19,248 | $5,130 | $14,118 |
Source: Public Records
Map
Nearby Homes
- 1489 E Algonquin Rd
- 1700 E Forest Ave
- 1278 E River Dr
- 1524 Oakwood Ave
- 1536 Orchard St
- 960 S River Rd Unit 410
- 960 S River Rd Unit 208
- 1365 Ashland Ave Unit 302
- 905 Center St Unit B507
- 905 Center St Unit B208
- 1632 S Elm St
- 1689 S Elm St
- 843 Lexington Cir E
- 1721 Linden St
- 1724 Illinois St
- 915 Graceland Ave Unit 1E
- 821 Lexington Cir E
- 2015 Busse Hwy
- 1640 S River Rd
- 799 Graceland Ave Unit 504A
- 1571 Van Buren Ave
- 1561 Van Buren Ave
- 1580 Whitcomb Ave
- 1541 Van Buren Ave
- 1570 Whitcomb Ave
- 1242 White St
- 1590 Whitcomb Ave
- 1556 Whitcomb Ave
- 1596 Whitcomb Ave
- 1271 White St
- 1580 Van Buren Ave
- 1523 Van Buren Ave
- 1540 Whitcomb Ave
- 1234 White St
- 1558 Van Buren Ave
- 1530 Whitcomb Ave
- 1301 White St
- 1538 Van Buren Ave
- 1613 Van Buren Ave
- 1269 S Cora St