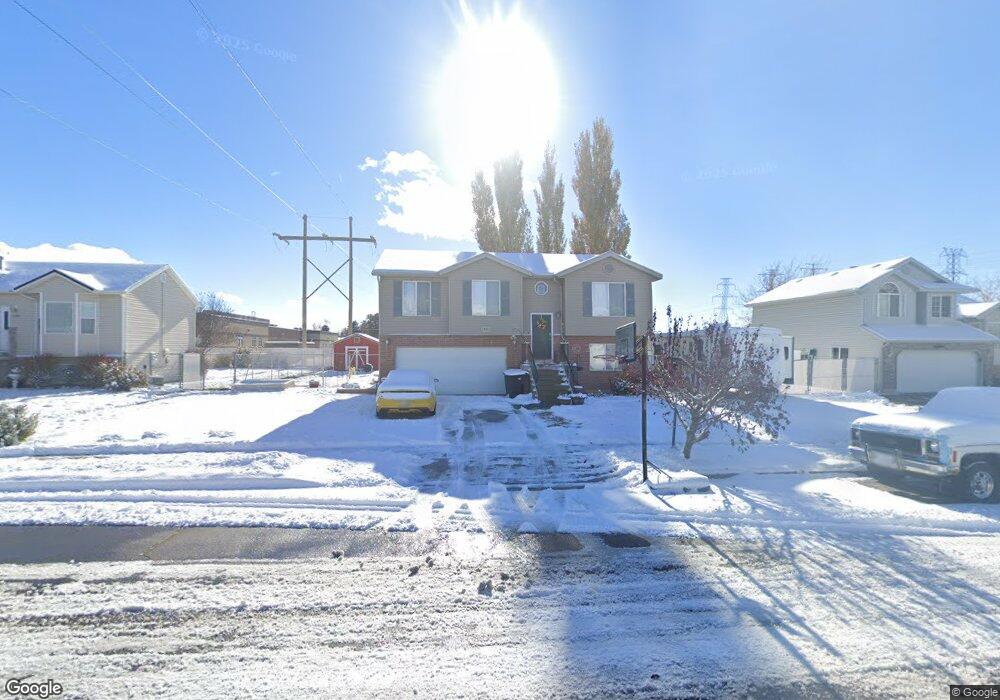
1581 W 1950 N Clearfield, UT 84015
Estimated Value: $405,000 - $442,000
3
Beds
2
Baths
1,491
Sq Ft
$284/Sq Ft
Est. Value
About This Home
This home is located at 1581 W 1950 N, Clearfield, UT 84015 and is currently estimated at $422,867, approximately $283 per square foot. 1581 W 1950 N is a home located in Davis County with nearby schools including Parkside Elementary School, Sunset Junior High School, and Clearfield High School.
Ownership History
Date
Name
Owned For
Owner Type
Purchase Details
Closed on
Mar 22, 2018
Sold by
Firth Jeremy H
Bought by
Firth Banu
Current Estimated Value
Purchase Details
Closed on
May 19, 2017
Sold by
Desantis Robyn
Bought by
Firth Jeremy H
Home Financials for this Owner
Home Financials are based on the most recent Mortgage that was taken out on this home.
Original Mortgage
$206,196
Outstanding Balance
$171,368
Interest Rate
4.25%
Mortgage Type
FHA
Estimated Equity
$251,499
Purchase Details
Closed on
Apr 8, 2014
Sold by
Stanton Ross L and Stanton Valerie
Bought by
Desantis Robyn
Home Financials for this Owner
Home Financials are based on the most recent Mortgage that was taken out on this home.
Original Mortgage
$144,000
Interest Rate
4.32%
Mortgage Type
New Conventional
Purchase Details
Closed on
May 5, 2009
Sold by
Stanton Ross and Stanton Valerie
Bought by
Stanton Ross L and Stanton Valerie
Home Financials for this Owner
Home Financials are based on the most recent Mortgage that was taken out on this home.
Original Mortgage
$122,000
Interest Rate
4.8%
Mortgage Type
New Conventional
Purchase Details
Closed on
Jun 10, 2006
Sold by
Stanton Ross and Stanton Valerie
Bought by
Stanton Ross and Stanton Valerie
Purchase Details
Closed on
Dec 10, 2003
Sold by
Cherry Brett N
Bought by
Boss Homes Llc
Home Financials for this Owner
Home Financials are based on the most recent Mortgage that was taken out on this home.
Original Mortgage
$98,400
Interest Rate
5.92%
Mortgage Type
Purchase Money Mortgage
Purchase Details
Closed on
Dec 9, 2003
Sold by
Boss Homes Llc
Bought by
Stanton Ross and Keith Valerie
Home Financials for this Owner
Home Financials are based on the most recent Mortgage that was taken out on this home.
Original Mortgage
$98,400
Interest Rate
5.92%
Mortgage Type
Purchase Money Mortgage
Purchase Details
Closed on
Jan 29, 2003
Sold by
Cherry Brett N and Cherry Brett
Bought by
Cherry Brett N
Home Financials for this Owner
Home Financials are based on the most recent Mortgage that was taken out on this home.
Original Mortgage
$92,800
Interest Rate
5.97%
Mortgage Type
Construction
Purchase Details
Closed on
Nov 20, 2001
Sold by
Northland Properties Llc
Bought by
Cherry Brett N and Carter Scott M
Home Financials for this Owner
Home Financials are based on the most recent Mortgage that was taken out on this home.
Original Mortgage
$498,500
Interest Rate
6.57%
Mortgage Type
Credit Line Revolving
Create a Home Valuation Report for This Property
The Home Valuation Report is an in-depth analysis detailing your home's value as well as a comparison with similar homes in the area
Home Values in the Area
Average Home Value in this Area
Purchase History
| Date | Buyer | Sale Price | Title Company |
|---|---|---|---|
| Firth Banu | -- | None Available | |
| Firth Jeremy H | -- | Inwest Title | |
| Desantis Robyn | -- | Us Title Company Of | |
| Stanton Ross L | -- | Backman Title Servi | |
| Stanton Ross | -- | Bonneville Superior Title Co | |
| Boss Homes Llc | -- | -- | |
| Stanton Ross | -- | -- | |
| Cherry Brett N | -- | Heritage West Title Insuranc | |
| Cherry Brett N | -- | Heritage West Title Insuranc | |
| Cherry Brett N | -- | Heritage West Title Insuranc |
Source: Public Records
Mortgage History
| Date | Status | Borrower | Loan Amount |
|---|---|---|---|
| Open | Firth Jeremy H | $206,196 | |
| Closed | Firth Jeremy H | $12,371 | |
| Previous Owner | Desantis Robyn | $144,000 | |
| Previous Owner | Stanton Ross L | $122,000 | |
| Previous Owner | Stanton Ross | $98,400 | |
| Previous Owner | Cherry Brett N | $92,800 | |
| Previous Owner | Cherry Brett N | $498,500 | |
| Closed | Stanton Ross | $24,600 |
Source: Public Records
Tax History Compared to Growth
Tax History
| Year | Tax Paid | Tax Assessment Tax Assessment Total Assessment is a certain percentage of the fair market value that is determined by local assessors to be the total taxable value of land and additions on the property. | Land | Improvement |
|---|---|---|---|---|
| 2025 | $2,162 | $207,900 | $78,352 | $129,548 |
| 2024 | $2,202 | $212,850 | $85,964 | $126,886 |
| 2023 | $1,985 | $355,000 | $98,088 | $256,912 |
| 2022 | $2,096 | $207,350 | $59,657 | $147,693 |
| 2021 | $1,942 | $285,000 | $75,265 | $209,735 |
| 2020 | $1,694 | $246,000 | $64,262 | $181,738 |
| 2019 | $1,663 | $236,000 | $74,524 | $161,476 |
| 2018 | $1,514 | $211,000 | $62,871 | $148,129 |
| 2016 | $1,380 | $99,330 | $27,359 | $71,971 |
| 2015 | $1,360 | $93,115 | $27,359 | $65,756 |
| 2014 | $1,131 | $78,663 | $27,359 | $51,304 |
| 2013 | -- | $83,230 | $27,143 | $56,087 |
Source: Public Records
Map
Nearby Homes