1581 W 800 S Claypool, IN 46510
Estimated Value: $212,000 - $306,199
3
Beds
2
Baths
1,200
Sq Ft
$225/Sq Ft
Est. Value
About This Home
This home is located at 1581 W 800 S, Claypool, IN 46510 and is currently estimated at $269,800, approximately $224 per square foot. 1581 W 800 S is a home with nearby schools including Claypool Elementary School, Edgewood Middle School, and Warsaw Community High School.
Ownership History
Date
Name
Owned For
Owner Type
Purchase Details
Closed on
Jul 21, 2021
Sold by
Stafford James E and Stafford James H
Bought by
Dausman Christopher R and Dausman Kaila Elizabeth
Current Estimated Value
Home Financials for this Owner
Home Financials are based on the most recent Mortgage that was taken out on this home.
Original Mortgage
$145,000
Outstanding Balance
$131,685
Interest Rate
2.96%
Mortgage Type
New Conventional
Estimated Equity
$138,115
Purchase Details
Closed on
Nov 5, 2007
Sold by
Lake City Bank
Bought by
Stafford James E and Stafford James H
Home Financials for this Owner
Home Financials are based on the most recent Mortgage that was taken out on this home.
Original Mortgage
$163,000
Interest Rate
6.44%
Mortgage Type
Future Advance Clause Open End Mortgage
Purchase Details
Closed on
Jul 24, 2006
Sold by
Harman Mark A and Harman John S
Bought by
Stafford John
Create a Home Valuation Report for This Property
The Home Valuation Report is an in-depth analysis detailing your home's value as well as a comparison with similar homes in the area
Home Values in the Area
Average Home Value in this Area
Purchase History
| Date | Buyer | Sale Price | Title Company |
|---|---|---|---|
| Dausman Christopher R | $215,000 | None Available | |
| Stafford James E | -- | None Available | |
| Stafford John | -- | None Available |
Source: Public Records
Mortgage History
| Date | Status | Borrower | Loan Amount |
|---|---|---|---|
| Open | Dausman Christopher R | $145,000 | |
| Previous Owner | Stafford James E | $163,000 |
Source: Public Records
Tax History Compared to Growth
Tax History
| Year | Tax Paid | Tax Assessment Tax Assessment Total Assessment is a certain percentage of the fair market value that is determined by local assessors to be the total taxable value of land and additions on the property. | Land | Improvement |
|---|---|---|---|---|
| 2024 | $1,648 | $257,600 | $31,000 | $226,600 |
| 2023 | $1,453 | $241,900 | $31,000 | $210,900 |
| 2022 | $1,373 | $219,300 | $31,000 | $188,300 |
| 2021 | $1,191 | $194,700 | $31,000 | $163,700 |
| 2020 | $2,067 | $177,100 | $28,000 | $149,100 |
| 2019 | $2,090 | $171,300 | $28,000 | $143,300 |
| 2018 | $2,039 | $164,000 | $28,000 | $136,000 |
| 2017 | $1,893 | $161,100 | $28,000 | $133,100 |
| 2016 | $1,989 | $158,900 | $27,000 | $131,900 |
| 2014 | $1,751 | $153,200 | $27,000 | $126,200 |
| 2013 | $1,751 | $154,200 | $27,000 | $127,200 |
Source: Public Records
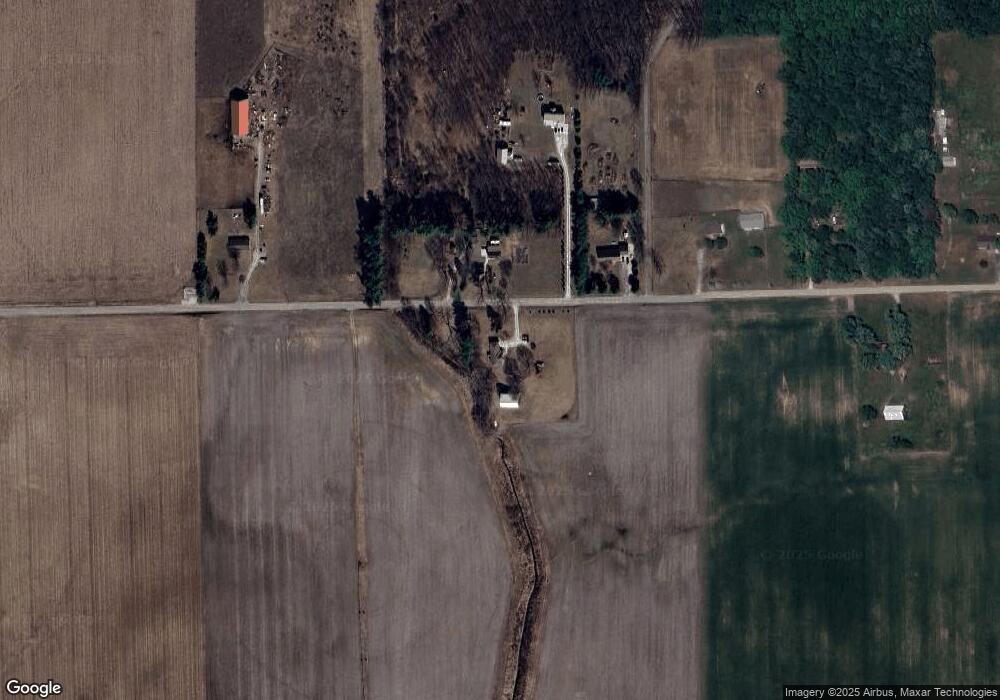
Map
Nearby Homes
- 204 S Graceland Ave
- 105 E Section St
- 102 S Main St
- 8920 S Merry Estates Dr
- 8727 S Hill Dr
- 7180 S 425 W
- 1016 S Roosevelt St
- 706 W Neher Rd
- 36.65 Acres Indiana 14
- 202 E Main St
- 408 E Sycamore St
- ** W Hoppus Rd
- * W Hoppus Rd
- 1895 E 800 S
- 5439 W Warren St
- 5445 W Warren St
- 4239 S Kinsey Rd
- 5925 W 850 S
- E St Rd 14
- 4280 S Scott Rd
- 1592 W 800 S
- 1516 W 800 S
- 1554 W 800 S
- 1464 W 800 S
- 1396 W 800 S
- 1359 W 800 S
- 1314 W 800 S
- 1887 W 800 S
- *** E 900 S
- ** E 900 S
- **** E 800 S
- 0 NE Corner of St Rd 13 & 14 Unit 1011380
- 1478 W 800 S
- 1232 W 800 S
- 1920 W 800 S
- ****** S Packerton Rd
- ***** S Packerton Rd
- **** S Packerton Rd
- *** S Packerton Rd
- ** S Packerton Rd