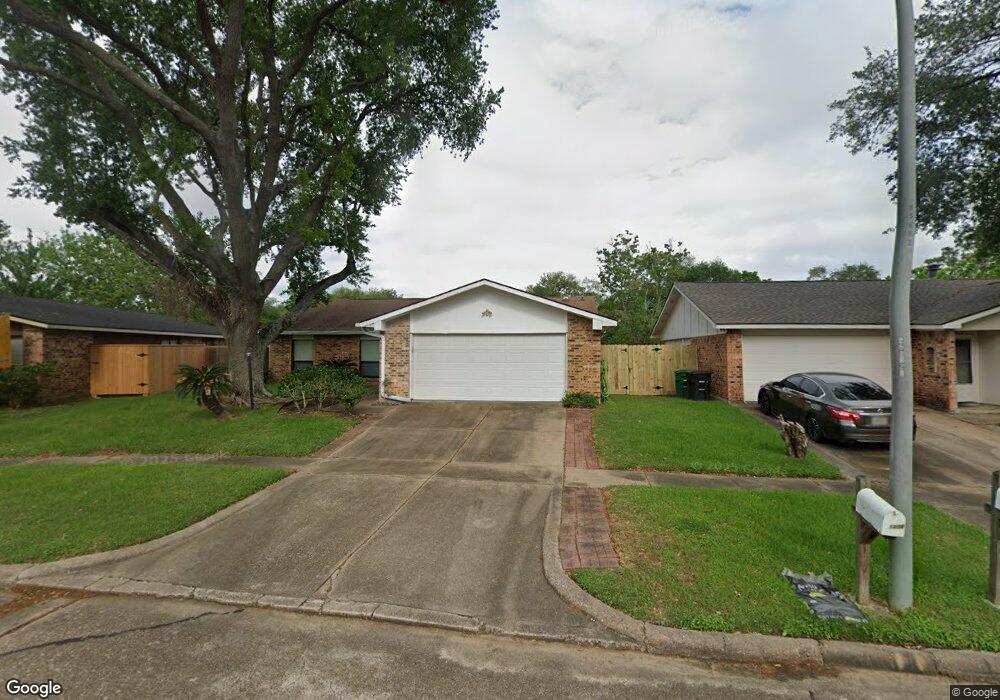
15810 Ironfork Dr Houston, TX 77053
Fort Bend Houston NeighborhoodEstimated Value: $229,000 - $254,000
3
Beds
2
Baths
1,918
Sq Ft
$126/Sq Ft
Est. Value
About This Home
This home is located at 15810 Ironfork Dr, Houston, TX 77053 and is currently estimated at $241,943, approximately $126 per square foot. 15810 Ironfork Dr is a home located in Fort Bend County with nearby schools including Ridgegate Elementary School, Christa McAuliffe Middle School, and Willowridge High School.
Ownership History
Date
Name
Owned For
Owner Type
Purchase Details
Closed on
Aug 1, 2005
Sold by
Johnson Odessa
Bought by
Vickers Donald L and Vickers Pamella S
Current Estimated Value
Home Financials for this Owner
Home Financials are based on the most recent Mortgage that was taken out on this home.
Original Mortgage
$80,000
Outstanding Balance
$42,349
Interest Rate
5.78%
Mortgage Type
Purchase Money Mortgage
Estimated Equity
$199,594
Purchase Details
Closed on
May 20, 2002
Sold by
Rector Roscoe S
Bought by
Vickers Donald L and Vickers Pamella S
Home Financials for this Owner
Home Financials are based on the most recent Mortgage that was taken out on this home.
Original Mortgage
$89,900
Interest Rate
7.1%
Purchase Details
Closed on
May 17, 2002
Sold by
Rector Roscoe S and Rector Sharon Lanell
Bought by
Johnson Odessa
Home Financials for this Owner
Home Financials are based on the most recent Mortgage that was taken out on this home.
Original Mortgage
$89,900
Interest Rate
7.1%
Create a Home Valuation Report for This Property
The Home Valuation Report is an in-depth analysis detailing your home's value as well as a comparison with similar homes in the area
Home Values in the Area
Average Home Value in this Area
Purchase History
| Date | Buyer | Sale Price | Title Company |
|---|---|---|---|
| Vickers Donald L | -- | American Title Company | |
| Vickers Donald L | -- | -- | |
| Vickers Donald L | -- | -- | |
| Johnson Odessa | -- | Fidelity National Title |
Source: Public Records
Mortgage History
| Date | Status | Borrower | Loan Amount |
|---|---|---|---|
| Open | Vickers Donald L | $80,000 | |
| Previous Owner | Johnson Odessa | $89,900 |
Source: Public Records
Tax History Compared to Growth
Tax History
| Year | Tax Paid | Tax Assessment Tax Assessment Total Assessment is a certain percentage of the fair market value that is determined by local assessors to be the total taxable value of land and additions on the property. | Land | Improvement |
|---|---|---|---|---|
| 2025 | $240 | $215,782 | $29,348 | $205,652 |
| 2024 | $240 | $196,165 | -- | $248,680 |
| 2023 | $187 | $178,332 | $0 | $227,223 |
| 2022 | $887 | $162,120 | $0 | $184,130 |
| 2021 | $3,263 | $147,380 | $22,580 | $124,800 |
| 2020 | $3,022 | $133,980 | $22,580 | $111,400 |
| 2019 | $2,889 | $121,800 | $22,580 | $99,220 |
| 2018 | $2,628 | $110,730 | $22,580 | $88,150 |
| 2017 | $2,416 | $100,660 | $22,580 | $78,080 |
| 2016 | $2,197 | $91,510 | $22,580 | $68,930 |
| 2015 | $646 | $83,190 | $22,580 | $60,610 |
| 2014 | $678 | $75,630 | $22,580 | $53,050 |
Source: Public Records
Map
Nearby Homes
- 15806 Corsair Rd
- 5710 W Ridgecreek Dr
- 15734 Briargate Ct
- 6101 Maywood Dr
- 5774 Gineridge Dr
- 15610 Briar Spring Ct
- 15770 Chimney Rock Rd
- 5614 Condon Ln
- 16210 Rosenridge Dr
- 15318 Corsair Rd
- 15903 Lenclaire Dr
- 6018 Beaconridge Dr
- 5734 Arthington St
- 15915 Dante Dr
- 16202 Bowridge Ln
- 5619 Gineridge Dr
- 15615 Raven Trail
- 5605 Melanite Ave
- 16226 Alden Ridge Dr
- 6407 Rambleridge Dr
- 15806 Ironfork Dr
- 15814 Ironfork Dr
- 15811 Ironside Creek Dr
- 15807 Ironside Creek Dr
- 15815 Ironside Creek Dr
- 15803 Ironside Creek Dr
- 15818 Ironfork Dr
- 15802 Ironfork Dr
- 15819 Ironside Creek Dr
- 15715 Ironside Creek Dr
- 15803 Ironfork Dr
- 15823 Ironside Creek Dr
- 6106 W Ridgecreek Dr
- 15815 Ironfork Dr
- 6110 W Ridgecreek Dr
- 15811 Ironfork Dr
- 15711 Ironside Creek Dr
- 6102 W Ridgecreek Dr
- 15819 Ironfork Dr
- 6107 Ironside Turn Dr