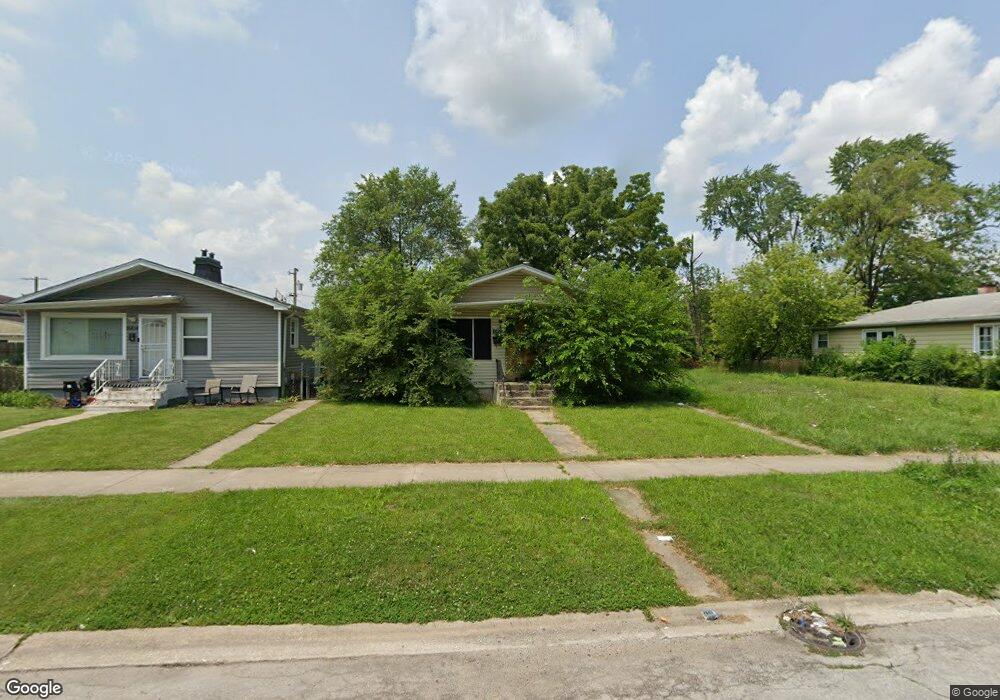
15810 Page Ave Harvey, IL 60426
Estimated Value: $103,000 - $112,697
3
Beds
1
Bath
988
Sq Ft
$108/Sq Ft
Est. Value
About This Home
This home is located at 15810 Page Ave, Harvey, IL 60426 and is currently estimated at $106,899, approximately $108 per square foot. 15810 Page Ave is a home located in Cook County with nearby schools including Maya Angelou Elementary School, Brooks Middle School, and Thornton Township High School.
Ownership History
Date
Name
Owned For
Owner Type
Purchase Details
Closed on
Jul 31, 2007
Sold by
Open Door Iii Llc
Bought by
Smith Glenn and Smith Latonya
Current Estimated Value
Home Financials for this Owner
Home Financials are based on the most recent Mortgage that was taken out on this home.
Original Mortgage
$75,900
Interest Rate
6.71%
Mortgage Type
Unknown
Purchase Details
Closed on
Sep 20, 2005
Sold by
Wyatt Margent
Bought by
Hud
Purchase Details
Closed on
May 16, 1997
Sold by
Kopec Jan and Strzep Franciszek
Bought by
Wyatt Margent
Home Financials for this Owner
Home Financials are based on the most recent Mortgage that was taken out on this home.
Original Mortgage
$50,150
Interest Rate
8.27%
Mortgage Type
FHA
Purchase Details
Closed on
Feb 21, 1996
Sold by
Vendee Mtg Trust 1994 & 3
Bought by
Kopec Jan and Strzep Franciszek
Purchase Details
Closed on
Sep 22, 1994
Sold by
Va
Bought by
Vendee Mtg Trust #1994 & 3
Create a Home Valuation Report for This Property
The Home Valuation Report is an in-depth analysis detailing your home's value as well as a comparison with similar homes in the area
Home Values in the Area
Average Home Value in this Area
Purchase History
| Date | Buyer | Sale Price | Title Company |
|---|---|---|---|
| Smith Glenn | $49,000 | Multiple | |
| Open Door Iii Llc | -- | Stewart Title Of Illinois | |
| Hud | -- | None Available | |
| Wyatt Margent | $50,000 | -- | |
| Kopec Jan | $38,250 | First American Title | |
| Vendee Mtg Trust #1994 & 3 | -- | -- | |
| Vendee Mtg Trust 1994 & 3 | -- | -- |
Source: Public Records
Mortgage History
| Date | Status | Borrower | Loan Amount |
|---|---|---|---|
| Closed | Smith Glenn | $75,900 | |
| Previous Owner | Wyatt Margent | $50,150 |
Source: Public Records
Tax History Compared to Growth
Tax History
| Year | Tax Paid | Tax Assessment Tax Assessment Total Assessment is a certain percentage of the fair market value that is determined by local assessors to be the total taxable value of land and additions on the property. | Land | Improvement |
|---|---|---|---|---|
| 2024 | $3,987 | $6,100 | $1,364 | $4,736 |
| 2023 | $3,660 | $6,100 | $1,364 | $4,736 |
| 2022 | $3,660 | $4,500 | $1,364 | $3,136 |
| 2021 | $3,535 | $4,500 | $1,364 | $3,136 |
| 2020 | $3,632 | $4,500 | $1,364 | $3,136 |
| 2019 | $4,251 | $5,478 | $1,240 | $4,238 |
| 2018 | $4,148 | $5,478 | $1,240 | $4,238 |
| 2017 | $4,053 | $5,478 | $1,240 | $4,238 |
| 2016 | $3,898 | $6,022 | $1,116 | $4,906 |
| 2015 | $3,743 | $6,022 | $1,116 | $4,906 |
| 2014 | $3,734 | $6,022 | $1,116 | $4,906 |
| 2013 | $4,035 | $6,633 | $1,116 | $5,517 |
Source: Public Records
Map
Nearby Homes
- 15734 Marshfield Ave
- 15944 Paulina St
- 15812 Lincoln Ave
- 15702 Marshfield Ave
- 16019 Wood St
- 28 E 157th St
- 15603 Marshfield Ave
- 15545 Lincoln Ave
- 16118 Paulina St
- 15804 Hoyne Ave
- 16122 Ashland Ave
- 16145 Honore Ave
- 15626 Myrtle Ave
- 69 E 159th St
- 16154 Wood St
- 112 W 155th St
- 15633 Myrtle Ave
- 189 W 156th Place
- 15711 Dixie Hwy
- 16018 Loomis Ave