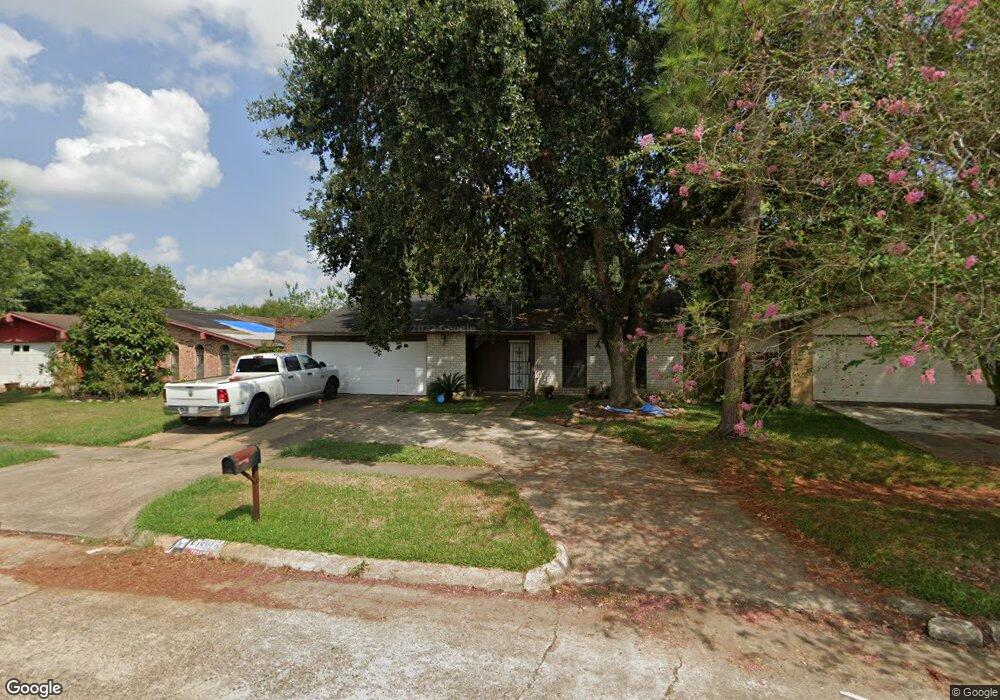
15811 Donforth Dr Houston, TX 77053
Fort Bend Houston NeighborhoodEstimated Value: $233,000 - $290,000
4
Beds
3
Baths
2,064
Sq Ft
$123/Sq Ft
Est. Value
About This Home
This home is located at 15811 Donforth Dr, Houston, TX 77053 and is currently estimated at $254,383, approximately $123 per square foot. 15811 Donforth Dr is a home located in Fort Bend County with nearby schools including Ridgegate Elementary School, Christa McAuliffe Middle School, and Willowridge High School.
Ownership History
Date
Name
Owned For
Owner Type
Purchase Details
Closed on
Mar 12, 2009
Sold by
Fast Investor Funding Lp
Bought by
Phipps Janice and Phipps Rickey
Current Estimated Value
Home Financials for this Owner
Home Financials are based on the most recent Mortgage that was taken out on this home.
Original Mortgage
$93,600
Interest Rate
5.44%
Mortgage Type
Seller Take Back
Purchase Details
Closed on
Feb 4, 2009
Sold by
Us Bank National Association
Bought by
Fast Investor Funding Lp
Home Financials for this Owner
Home Financials are based on the most recent Mortgage that was taken out on this home.
Original Mortgage
$93,600
Interest Rate
5.44%
Mortgage Type
Seller Take Back
Purchase Details
Closed on
Aug 5, 2008
Sold by
Burley Janett S
Bought by
Us Bank Na and Home Equity Loan Trust 2005-He2
Purchase Details
Closed on
Jun 14, 1995
Sold by
Lockett William Charles and Lockett Lottie Faye
Bought by
Sampson Janett
Create a Home Valuation Report for This Property
The Home Valuation Report is an in-depth analysis detailing your home's value as well as a comparison with similar homes in the area
Home Values in the Area
Average Home Value in this Area
Purchase History
| Date | Buyer | Sale Price | Title Company |
|---|---|---|---|
| Phipps Janice | -- | None Available | |
| Phipps Janice | -- | -- | |
| Fast Investor Funding Lp | -- | Lsi Title Agency | |
| Phipps Janice | -- | -- | |
| Us Bank Na | $74,800 | None Available | |
| Phipps Janice | -- | -- | |
| Sampson Janett | -- | First American Title |
Source: Public Records
Mortgage History
| Date | Status | Borrower | Loan Amount |
|---|---|---|---|
| Previous Owner | Phipps Janice | $93,600 |
Source: Public Records
Tax History Compared to Growth
Tax History
| Year | Tax Paid | Tax Assessment Tax Assessment Total Assessment is a certain percentage of the fair market value that is determined by local assessors to be the total taxable value of land and additions on the property. | Land | Improvement |
|---|---|---|---|---|
| 2025 | $1,062 | $129,520 | $26,000 | $214,554 |
| 2024 | $1,062 | $117,745 | -- | $233,025 |
| 2023 | $890 | $107,041 | $0 | $159,711 |
| 2022 | $1,417 | $97,310 | $0 | $125,900 |
| 2021 | $1,958 | $88,460 | $20,000 | $68,460 |
| 2020 | $1,814 | $80,420 | $20,000 | $60,420 |
| 2019 | $1,734 | $73,110 | $20,000 | $53,110 |
| 2018 | $1,577 | $66,460 | $20,000 | $46,460 |
| 2017 | $1,450 | $60,420 | $20,000 | $40,420 |
| 2016 | $1,319 | $54,930 | $20,000 | $34,930 |
| 2015 | $528 | $49,940 | $20,000 | $29,940 |
| 2014 | $587 | $45,400 | $20,000 | $25,400 |
Source: Public Records
Map
Nearby Homes
- 5710 W Ridgecreek Dr
- 15903 Lenclaire Dr
- 5614 Condon Ln
- 5774 Gineridge Dr
- 15915 Dante Dr
- 5605 Melanite Ave
- 5619 Gineridge Dr
- 5734 Arthington St
- 15806 Corsair Rd
- 6101 Maywood Dr
- 16226 Alden Ridge Dr
- 5622 Lycomb Dr
- 6018 Beaconridge Dr
- 5418 Arthington St
- 16210 Rosenridge Dr
- 15734 Briargate Ct
- 15318 Corsair Rd
- 5310 Ridgeton Dr
- 16326 Bantam Ridge Ct
- 16202 Bowridge Ln
- 15807 Donforth Dr
- 15815 Donforth Dr
- 15814 Danford Dr
- 15803 Donforth Dr
- 15819 Donforth Dr
- 15810 Danford Dr
- 15818 Danford Dr
- 15806 Danford Dr
- 15810 Donforth Dr
- 15814 Donforth Dr
- 15723 Donforth Dr
- 15806 Donforth Dr
- 15823 Donforth Dr
- 15822 Danford Dr
- 15818 Donforth Dr
- 15802 Danford Dr
- 15802 Donforth Dr
- 15719 Donforth Dr
- 15822 Donforth Dr
- 15718 Danford Dr