Estimated Value: $446,000 - $485,000
3
Beds
2
Baths
1,857
Sq Ft
$248/Sq Ft
Est. Value
About This Home
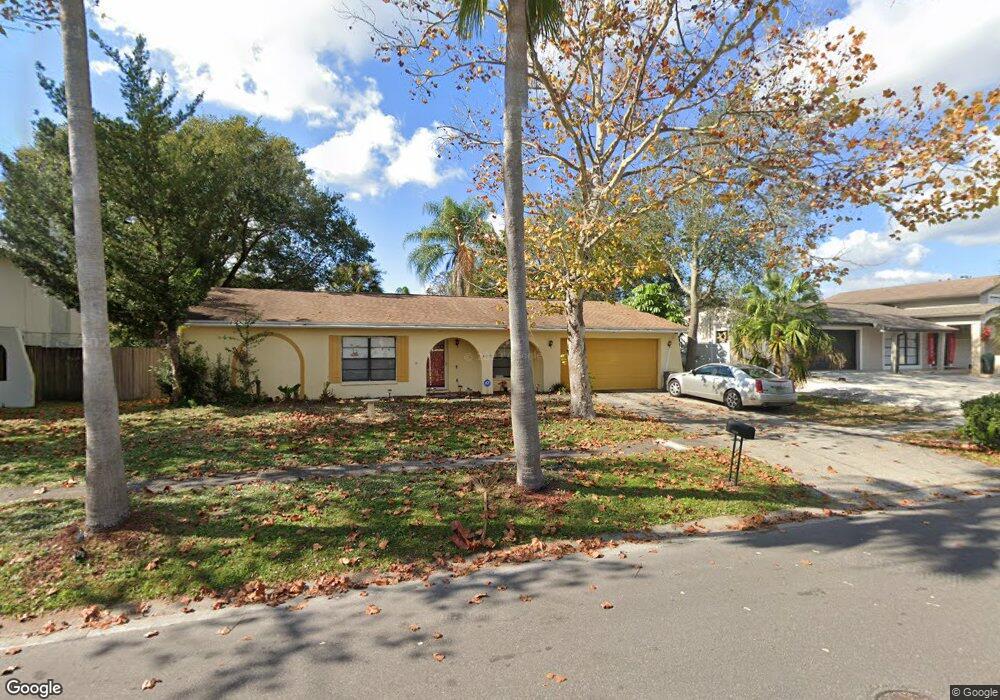
This home is located at 15816 Spring Crest Cir, Tampa, FL 33624 and is currently estimated at $461,318, approximately $248 per square foot. 15816 Spring Crest Cir is a home located in Hillsborough County with nearby schools including Claywell Elementary School, Hill Middle School, and Gaither High School.
Ownership History
Date
Name
Owned For
Owner Type
Purchase Details
Closed on
Mar 30, 2007
Sold by
Garris Kenneth Charles
Bought by
Kindred Henry and Kindred Sherryl
Current Estimated Value
Home Financials for this Owner
Home Financials are based on the most recent Mortgage that was taken out on this home.
Original Mortgage
$225,250
Outstanding Balance
$135,817
Interest Rate
6.1%
Mortgage Type
Balloon
Estimated Equity
$325,501
Purchase Details
Closed on
Sep 13, 1999
Sold by
Martin Raymond V and Martin L
Bought by
Garris Kenneth C
Home Financials for this Owner
Home Financials are based on the most recent Mortgage that was taken out on this home.
Original Mortgage
$114,511
Interest Rate
7.73%
Mortgage Type
VA
Purchase Details
Closed on
Oct 7, 1998
Sold by
Mantei J Martin
Bought by
Martin Raymond V and Martin Bonnie L
Purchase Details
Closed on
Dec 2, 1993
Sold by
Mantei J Martin and Mantei Marlene A
Bought by
Mantei J Martin
Create a Home Valuation Report for This Property
The Home Valuation Report is an in-depth analysis detailing your home's value as well as a comparison with similar homes in the area
Home Values in the Area
Average Home Value in this Area
Purchase History
| Date | Buyer | Sale Price | Title Company |
|---|---|---|---|
| Kindred Henry | $182,000 | Acura Title Co | |
| Garris Kenneth C | $112,300 | -- | |
| Martin Raymond V | $107,000 | -- | |
| Mantei J Martin | $18,900 | -- |
Source: Public Records
Mortgage History
| Date | Status | Borrower | Loan Amount |
|---|---|---|---|
| Open | Kindred Henry | $225,250 | |
| Previous Owner | Martin Raymond V | $128,128 | |
| Previous Owner | Martin Raymond V | $121,856 | |
| Previous Owner | Martin Raymond V | $117,684 | |
| Previous Owner | Martin Raymond V | $114,511 |
Source: Public Records
Tax History Compared to Growth
Tax History
| Year | Tax Paid | Tax Assessment Tax Assessment Total Assessment is a certain percentage of the fair market value that is determined by local assessors to be the total taxable value of land and additions on the property. | Land | Improvement |
|---|---|---|---|---|
| 2024 | $5,095 | $140,096 | -- | -- |
| 2023 | $4,977 | $136,016 | $0 | $0 |
| 2022 | $4,799 | $132,054 | $0 | $0 |
| 2021 | $4,764 | $128,208 | $0 | $0 |
| 2020 | $4,685 | $126,438 | $0 | $0 |
| 2019 | $1,999 | $123,595 | $0 | $0 |
| 2018 | $1,946 | $121,290 | $0 | $0 |
| 2017 | $1,914 | $177,326 | $0 | $0 |
| 2016 | $1,877 | $116,352 | $0 | $0 |
| 2015 | $1,895 | $115,543 | $0 | $0 |
| 2014 | $1,870 | $114,626 | $0 | $0 |
| 2013 | -- | $112,932 | $0 | $0 |
Source: Public Records
Map
Nearby Homes
- 4632 Landscape Dr
- 15816 Hound Horn Ln Unit IVA
- 4646 Landscape Dr
- 4706 Fox Hunt Dr
- 4444 Ranchwood Ln
- 16116 Gardendale Dr
- 16127 Gardendale Dr
- 4313 Hollow Hill Dr
- 15908 Country Place
- 4421 Ranchwood Ln
- 4404 Grainary Ave
- 4603 Powder Horn Ct
- 16221 Rambling Vine Dr W
- 16143 Rambling Vine Dr E
- 16175 Rambling Vine Dr E
- 16138 Manorwood Cir
- 16191 Rambling Vine Dr E
- 4237 Brentwood Park Cir
- 4402 Willowrun Ln
- 16311 Rambling Vine Dr W
- 15818 Spring Crest Cir
- 15814 Spring Crest Cir
- 15813 Sapwood St
- 15811 Sapwood St
- 15815 Sapwood St
- 4605 White Pine Ln
- 15812 Spring Crest Cir
- 15820 Spring Crest Cir
- 4606 White Pine Ln
- 15809 Sapwood St
- 15817 Sapwood St
- 4606 Sandy Creek Ln
- 15807 Spring Crest Cir
- 4603 White Pine Ln
- 4604 White Pine Ln
- 15822 Spring Crest Cir
- 15807 Sapwood St
- 15810 Spring Crest Cir
- 15819 Sapwood St
- 15814 Sapwood St