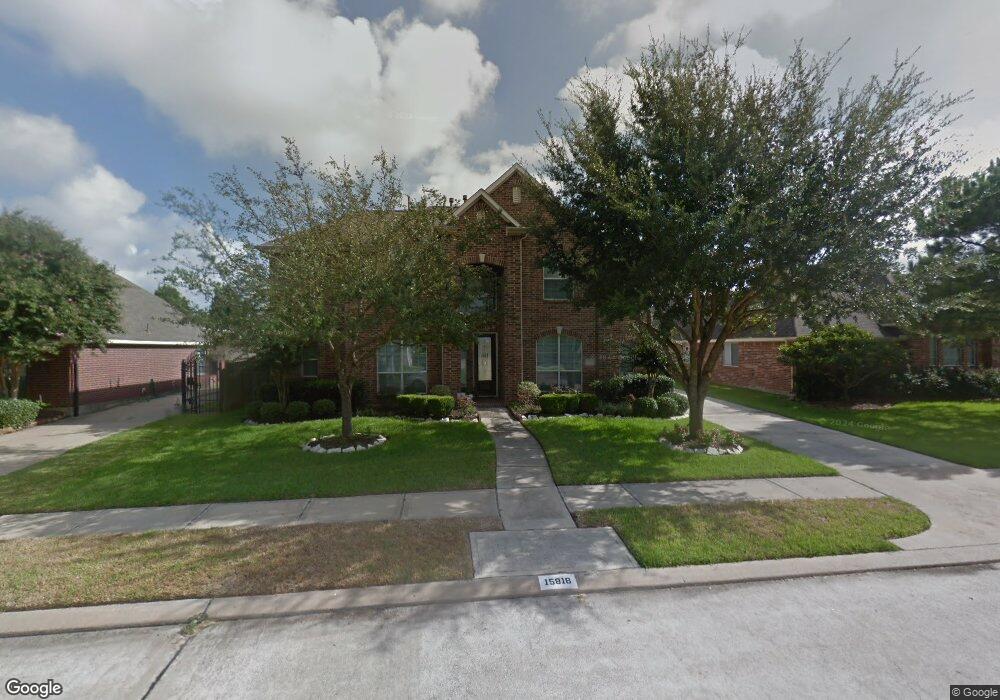
15818 Sweetrose Place Houston, TX 77095
Estimated Value: $394,633 - $415,000
4
Beds
4
Baths
3,012
Sq Ft
$136/Sq Ft
Est. Value
About This Home
This home is located at 15818 Sweetrose Place, Houston, TX 77095 and is currently estimated at $409,158, approximately $135 per square foot. 15818 Sweetrose Place is a home located in Harris County with nearby schools including Fiest Elementary School, Labay Middle School, and Cypress Falls High School.
Ownership History
Date
Name
Owned For
Owner Type
Purchase Details
Closed on
Apr 23, 2015
Sold by
Leung Shiu C
Bought by
Leung Shiu C and Wong Leung Chung H
Current Estimated Value
Home Financials for this Owner
Home Financials are based on the most recent Mortgage that was taken out on this home.
Original Mortgage
$140,822
Outstanding Balance
$51,889
Interest Rate
3.84%
Mortgage Type
FHA
Estimated Equity
$357,269
Purchase Details
Closed on
Dec 31, 2013
Sold by
Leung Shiu C
Bought by
Leung Shiu C Cheung
Purchase Details
Closed on
Aug 22, 2003
Sold by
Morrison Homes Of Texas Inc
Bought by
Leung Shiu C
Home Financials for this Owner
Home Financials are based on the most recent Mortgage that was taken out on this home.
Original Mortgage
$165,564
Interest Rate
5.87%
Mortgage Type
Purchase Money Mortgage
Create a Home Valuation Report for This Property
The Home Valuation Report is an in-depth analysis detailing your home's value as well as a comparison with similar homes in the area
Home Values in the Area
Average Home Value in this Area
Purchase History
| Date | Buyer | Sale Price | Title Company |
|---|---|---|---|
| Leung Shiu C | -- | None Available | |
| Leung Shiu C Cheung | -- | None Available | |
| Leung Shiu C | -- | Mfs Title Of Texas Lp |
Source: Public Records
Mortgage History
| Date | Status | Borrower | Loan Amount |
|---|---|---|---|
| Open | Leung Shiu C | $140,822 | |
| Closed | Leung Shiu C | $165,564 |
Source: Public Records
Tax History Compared to Growth
Tax History
| Year | Tax Paid | Tax Assessment Tax Assessment Total Assessment is a certain percentage of the fair market value that is determined by local assessors to be the total taxable value of land and additions on the property. | Land | Improvement |
|---|---|---|---|---|
| 2025 | $3,791 | $380,169 | $71,726 | $308,443 |
| 2024 | $3,791 | $380,169 | $71,726 | $308,443 |
| 2023 | $3,791 | $384,203 | $71,726 | $312,477 |
| 2022 | $7,894 | $348,125 | $53,033 | $295,092 |
| 2021 | $7,595 | $293,139 | $53,033 | $240,106 |
| 2020 | $7,541 | $279,367 | $43,905 | $235,462 |
| 2019 | $7,216 | $259,496 | $33,907 | $225,589 |
| 2018 | $1,869 | $237,439 | $33,907 | $203,532 |
| 2017 | $6,639 | $237,439 | $33,907 | $203,532 |
| 2016 | $6,639 | $237,439 | $33,907 | $203,532 |
| 2015 | $3,235 | $237,439 | $33,907 | $203,532 |
| 2014 | $3,235 | $228,696 | $32,168 | $196,528 |
Source: Public Records
Map
Nearby Homes
- 15802 Aberdeen Trails Dr
- 9138 Shango Ln
- 9111 Sunny Ridge Dr
- 15906 Marwick Ct
- 8818 Apple Mill Dr
- 9303 Reston Grove Ln
- 15735 Jamie Lee Dr
- 15627 Kentwater Ct
- 8814 Sherina Park Dr
- 15610 Manorford Ct
- 15610 Tarpon Springs Ct
- 8526 Greenleaf Lake Dr
- 16111 Aberdeen Forest Dr
- 15634 Haleys Landing Ln
- 16123 Aberdeen Forest Dr
- 15954 Oak Mountain Dr
- 8550 Sparkling Springs Dr
- 15407 Copper Branch Ln
- 21218 Branchport Dr
- 16211 Green Smoke Dr
- 15814 Sweetrose Place
- 15822 Sweetrose Place
- 15811 Swandale Ln
- 15815 Swandale Ln
- 15807 Swandale Ln
- 15810 Sweetrose Place
- 15826 Sweetrose Place
- 15823 Sweetrose Place
- 15803 Swandale Ln
- 15819 Swandale Ln
- 15815 Sweetrose Place
- 15827 Sweetrose Place
- 15806 Sweetrose Place
- 15811 Sweetrose Place
- 15727 Swandale Ln
- 15831 Sweetrose Place
- 15810 Swandale Ln
- 15814 Swandale Ln
- 15807 Sweetrose Place
- 15830 Aberdeen Trails Dr