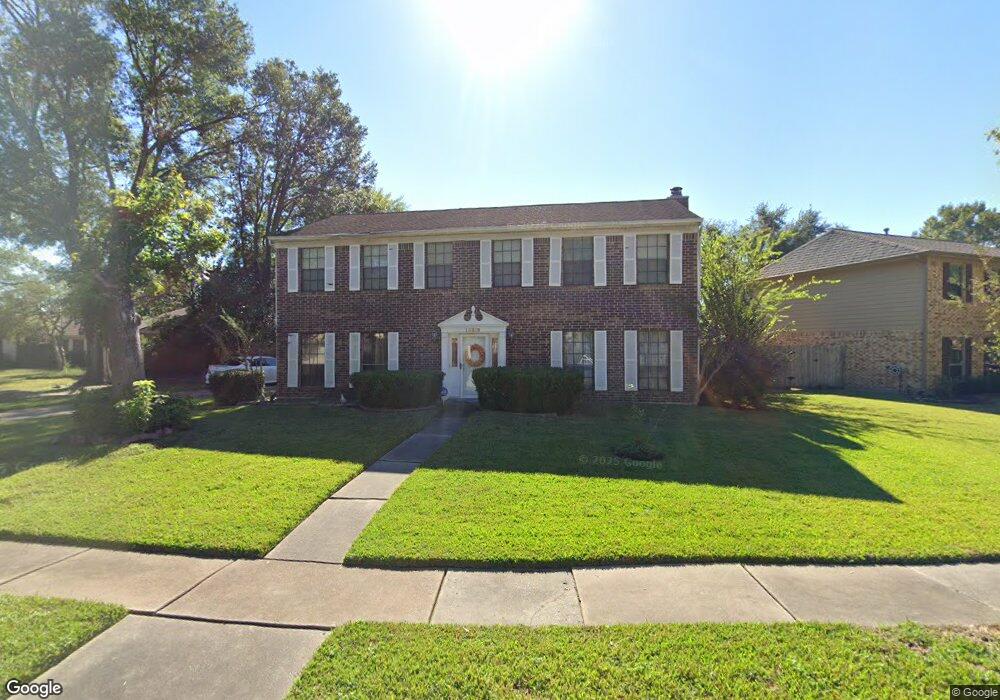
15819 Lakecliffe Dr Houston, TX 77095
Copperfield NeighborhoodEstimated Value: $290,000 - $333,000
5
Beds
5
Baths
2,580
Sq Ft
$122/Sq Ft
Est. Value
About This Home
This home is located at 15819 Lakecliffe Dr, Houston, TX 77095 and is currently estimated at $314,177, approximately $121 per square foot. 15819 Lakecliffe Dr is a home located in Harris County with nearby schools including Fiest Elementary School, Labay Middle School, and Cypress Falls High School.
Ownership History
Date
Name
Owned For
Owner Type
Purchase Details
Closed on
Nov 18, 2014
Sold by
Secretary Of Hud
Bought by
Helataei Aisha N
Current Estimated Value
Home Financials for this Owner
Home Financials are based on the most recent Mortgage that was taken out on this home.
Original Mortgage
$139,499
Outstanding Balance
$109,737
Interest Rate
4.75%
Mortgage Type
FHA
Estimated Equity
$204,440
Purchase Details
Closed on
Mar 25, 2014
Sold by
Jpmorgan Chase Bank Na
Bought by
The Secretary Of Hud
Purchase Details
Closed on
Apr 3, 2012
Sold by
Haisley Jenianne and Haisley Richard Baldwin
Bought by
Jpmorgan Chase Bank
Purchase Details
Closed on
Oct 11, 2001
Sold by
Flood John Edmond and Flood Alice S
Bought by
Haisley Richard Baldwin and Haisley Jenianne
Home Financials for this Owner
Home Financials are based on the most recent Mortgage that was taken out on this home.
Original Mortgage
$134,883
Interest Rate
6.84%
Mortgage Type
FHA
Create a Home Valuation Report for This Property
The Home Valuation Report is an in-depth analysis detailing your home's value as well as a comparison with similar homes in the area
Home Values in the Area
Average Home Value in this Area
Purchase History
| Date | Buyer | Sale Price | Title Company |
|---|---|---|---|
| Helataei Aisha N | -- | First American Title | |
| The Secretary Of Hud | -- | None Available | |
| Jpmorgan Chase Bank | $120,000 | None Available | |
| Haisley Richard Baldwin | -- | First American Title |
Source: Public Records
Mortgage History
| Date | Status | Borrower | Loan Amount |
|---|---|---|---|
| Open | Helataei Aisha N | $139,499 | |
| Previous Owner | Haisley Richard Baldwin | $134,883 |
Source: Public Records
Tax History Compared to Growth
Tax History
| Year | Tax Paid | Tax Assessment Tax Assessment Total Assessment is a certain percentage of the fair market value that is determined by local assessors to be the total taxable value of land and additions on the property. | Land | Improvement |
|---|---|---|---|---|
| 2025 | $3,416 | $273,262 | $73,883 | $199,379 |
| 2024 | $3,416 | $266,719 | $66,031 | $200,688 |
| 2023 | $3,416 | $276,673 | $66,031 | $210,642 |
| 2022 | $5,162 | $261,407 | $50,683 | $210,724 |
| 2021 | $4,944 | $212,966 | $50,683 | $162,283 |
| 2020 | $4,818 | $202,029 | $42,117 | $159,912 |
| 2019 | $4,534 | $190,155 | $33,194 | $156,961 |
| 2018 | $1,564 | $167,000 | $33,194 | $133,806 |
| 2017 | $3,830 | $177,161 | $33,194 | $143,967 |
| 2016 | $4,064 | $177,161 | $33,194 | $143,967 |
| 2015 | $3,641 | $171,413 | $33,194 | $138,219 |
| 2014 | $3,641 | $151,511 | $27,840 | $123,671 |
Source: Public Records
Map
Nearby Homes
- 8203 Green Devon Dr
- 15918 Pinyon Creek Dr
- 8211 Riverglade Dr
- 15854 Knolls Lodge Dr
- 8526 Hot Springs Dr
- 15611 Meadow Village Dr
- 15339 Glenwood Park Dr
- 8306 Lake Crystal Dr
- 16026 Autumn Falls Ln
- 15954 Oak Mountain Dr
- 8526 Greenleaf Lake Dr
- 8550 Sparkling Springs Dr
- 16030 Royal Garden Dr
- 16114 Kintyre Point Rd
- 7731 Club Lake Dr
- 8426 Laurel Trails Dr
- 15131 New Hastings Dr
- 15415 Swan Creek Dr
- 15414 Swan Creek Dr
- 16215 Wemyss Bay Rd
- 15827 Lakecliffe Dr
- 15811 Lakecliffe Dr
- 8018 Silver Fir Dr
- 15803 Lakecliffe Dr
- 15818 Lakecliffe Dr
- 15814 Lakecliffe Dr
- 15822 Lakecliffe Dr
- 15826 Lakecliffe Dr
- 8014 Silver Fir Dr
- 15810 Lakecliffe Dr
- 15802 Lakecliffe Dr
- 8103 Silver Fir Dr
- 8019 Silver Fir Dr
- 8107 Silver Fir Dr
- 8015 Green Devon Dr
- 15806 Lakecliffe Dr
- 8015 Silver Fir Dr
- 8019 Green Devon Dr
- 8111 Silver Fir Dr
- 8010 Silver Fir Dr