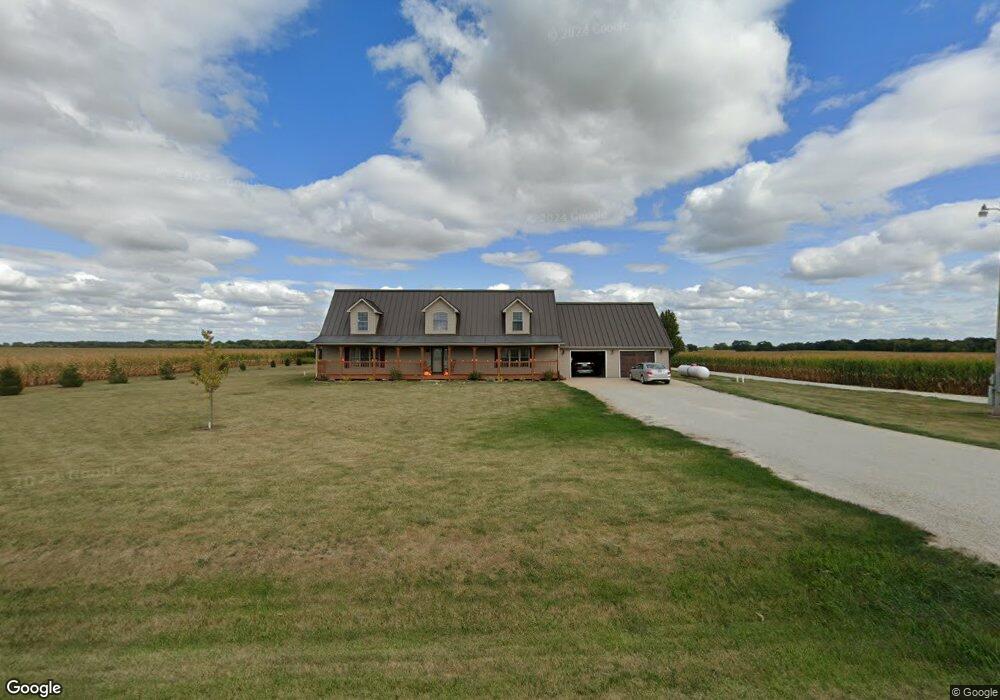
15824 N 2600 East Rd Saunemin, IL 61769
Estimated Value: $237,000 - $414,476
5
Beds
2
Baths
2,856
Sq Ft
$113/Sq Ft
Est. Value
About This Home
This home is located at 15824 N 2600 East Rd, Saunemin, IL 61769 and is currently estimated at $321,369, approximately $112 per square foot. 15824 N 2600 East Rd is a home located in Livingston County with nearby schools including Saunemin Elementary School and Pontiac High School.
Ownership History
Date
Name
Owned For
Owner Type
Purchase Details
Closed on
Mar 13, 2020
Sold by
Sancken Lucas and Sancken Lydia
Bought by
Wepprecht Caleb
Current Estimated Value
Home Financials for this Owner
Home Financials are based on the most recent Mortgage that was taken out on this home.
Original Mortgage
$170,000
Outstanding Balance
$150,272
Interest Rate
3.4%
Mortgage Type
Adjustable Rate Mortgage/ARM
Estimated Equity
$171,097
Purchase Details
Closed on
Oct 24, 2013
Sold by
North Breanne N
Bought by
Sancken Lucas
Purchase Details
Closed on
Jun 7, 2012
Sold by
Citizens Equity First Credit Union
Bought by
Sancken Lucas and North Breanna N
Home Financials for this Owner
Home Financials are based on the most recent Mortgage that was taken out on this home.
Original Mortgage
$125,000
Interest Rate
3.87%
Create a Home Valuation Report for This Property
The Home Valuation Report is an in-depth analysis detailing your home's value as well as a comparison with similar homes in the area
Home Values in the Area
Average Home Value in this Area
Purchase History
| Date | Buyer | Sale Price | Title Company |
|---|---|---|---|
| Wepprecht Caleb | $212,500 | None Available | |
| Sancken Lucas | -- | -- | |
| Sancken Lucas | $120,000 | -- |
Source: Public Records
Mortgage History
| Date | Status | Borrower | Loan Amount |
|---|---|---|---|
| Open | Wepprecht Caleb | $170,000 | |
| Previous Owner | Sancken Lucas | $125,000 |
Source: Public Records
Tax History Compared to Growth
Tax History
| Year | Tax Paid | Tax Assessment Tax Assessment Total Assessment is a certain percentage of the fair market value that is determined by local assessors to be the total taxable value of land and additions on the property. | Land | Improvement |
|---|---|---|---|---|
| 2024 | $6,096 | $109,301 | $7,035 | $102,266 |
| 2023 | $5,802 | $99,364 | $6,395 | $92,969 |
| 2022 | $5,414 | $71,875 | $5,971 | $65,904 |
| 2021 | $4,312 | $56,621 | $5,612 | $51,009 |
| 2020 | $4,261 | $53,925 | $5,345 | $48,580 |
| 2019 | $4,343 | $53,925 | $5,345 | $48,580 |
| 2018 | $4,270 | $52,742 | $6,937 | $45,805 |
| 2017 | $4,209 | $51,206 | $6,735 | $44,471 |
| 2016 | $4,138 | $49,715 | $6,539 | $43,176 |
| 2015 | $4,009 | $46,203 | $6,077 | $40,126 |
| 2013 | $4,256 | $49,656 | $6,152 | $43,504 |
Source: Public Records
Map
Nearby Homes
- 59 Main St
- 30 Plum St
- 44 Lafayette St
- 105 W Martin St
- 322 E Watson St
- 306 E Martin St
- 21416 E 2300 North Rd
- 316 W John St
- 313 E Orchard St
- 17864 E 1700 Rd N
- 100 E Willow St
- 912 E Locust St
- 209 N 7th St
- 126 E Cleveland St
- 700 E North St
- 205 E Jeffery St
- 505 E Elm St
- 402 W Ash St
- 7691 N 3000 East Rd
- 104 Lake View Dr