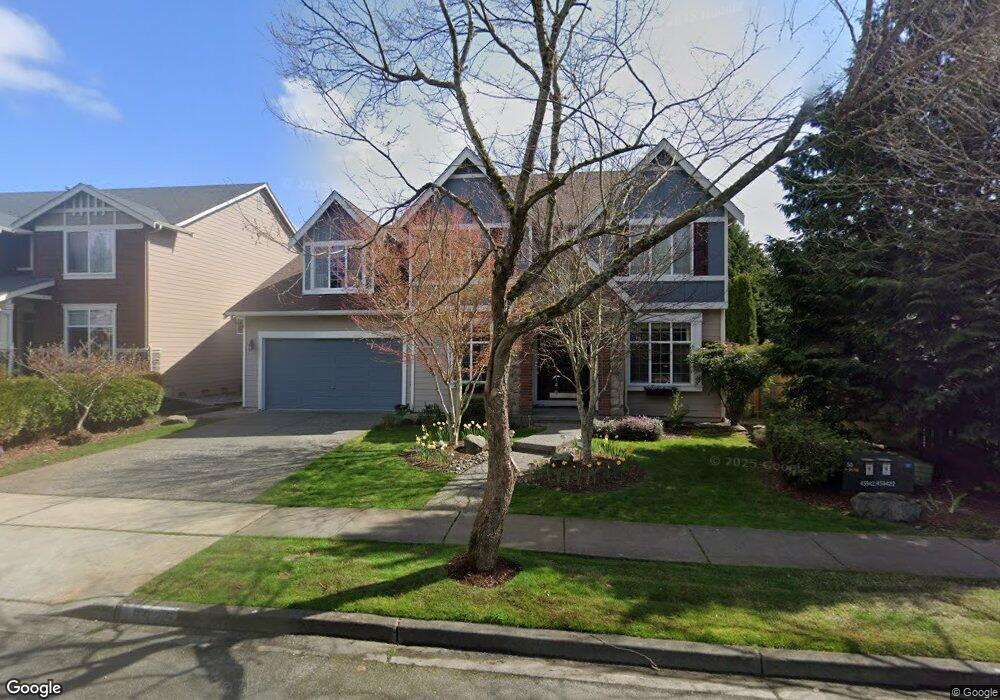
15825 35th Dr SE Bothell, WA 98012
Estimated Value: $1,401,150 - $1,464,000
4
Beds
3
Baths
3,076
Sq Ft
$465/Sq Ft
Est. Value
About This Home
This home is located at 15825 35th Dr SE, Bothell, WA 98012 and is currently estimated at $1,429,538, approximately $464 per square foot. 15825 35th Dr SE is a home located in Snohomish County with nearby schools including Forest View Elementary School, Gateway Middle School, and Henry M. Jackson High School.
Ownership History
Date
Name
Owned For
Owner Type
Purchase Details
Closed on
Jun 15, 2010
Sold by
Buell Terence B and Buell Brenda J
Bought by
Foley Brian P and Foley Lindsay A Mcbeth
Current Estimated Value
Home Financials for this Owner
Home Financials are based on the most recent Mortgage that was taken out on this home.
Original Mortgage
$417,000
Outstanding Balance
$279,749
Interest Rate
4.99%
Mortgage Type
New Conventional
Estimated Equity
$1,149,789
Purchase Details
Closed on
Feb 2, 2009
Sold by
Kim Hyun Ja
Bought by
Buell Terence B and Buell Brenda J
Home Financials for this Owner
Home Financials are based on the most recent Mortgage that was taken out on this home.
Original Mortgage
$364,000
Interest Rate
5.01%
Mortgage Type
Purchase Money Mortgage
Purchase Details
Closed on
Apr 21, 2006
Sold by
Lozier At Seasons Llc
Bought by
Kim Hyun Ja
Home Financials for this Owner
Home Financials are based on the most recent Mortgage that was taken out on this home.
Original Mortgage
$32,950
Interest Rate
6.29%
Mortgage Type
Credit Line Revolving
Create a Home Valuation Report for This Property
The Home Valuation Report is an in-depth analysis detailing your home's value as well as a comparison with similar homes in the area
Home Values in the Area
Average Home Value in this Area
Purchase History
| Date | Buyer | Sale Price | Title Company |
|---|---|---|---|
| Foley Brian P | $479,000 | Chicago Title | |
| Buell Terence B | $455,000 | Chicago Title | |
| Kim Hyun Ja | $544,950 | Chicago Title |
Source: Public Records
Mortgage History
| Date | Status | Borrower | Loan Amount |
|---|---|---|---|
| Open | Foley Brian P | $417,000 | |
| Previous Owner | Buell Terence B | $364,000 | |
| Previous Owner | Kim Hyun Ja | $32,950 | |
| Previous Owner | Kim Hyun Ja | $417,000 |
Source: Public Records
Tax History
| Year | Tax Paid | Tax Assessment Tax Assessment Total Assessment is a certain percentage of the fair market value that is determined by local assessors to be the total taxable value of land and additions on the property. | Land | Improvement |
|---|---|---|---|---|
| 2025 | $10,334 | $1,174,300 | $630,000 | $544,300 |
| 2024 | $10,334 | $1,100,500 | $600,000 | $500,500 |
| 2023 | $10,565 | $1,234,000 | $665,000 | $569,000 |
| 2022 | $7,905 | $797,800 | $358,000 | $439,800 |
| 2020 | $8,692 | $737,500 | $335,000 | $402,500 |
| 2019 | $8,144 | $693,700 | $295,000 | $398,700 |
| 2018 | $7,808 | $605,800 | $250,000 | $355,800 |
| 2017 | $6,769 | $529,600 | $195,000 | $334,600 |
| 2016 | $6,444 | $520,300 | $182,000 | $338,300 |
Source: Public Records
Map
Nearby Homes
- 3621 156th Place SE
- 16519 37th Dr SE
- 16606 35th Ave SE Unit 9A
- 2910 151st Place SE
- 15530 Sunset Rd
- 2728 164th Place SE
- 4233 154th Place SE
- 2821 152nd Place SE
- 15000 Village Green Dr Unit 22
- 4003 168th Place SE
- 3616 147th Place SE
- 3701 170th Place SE
- 17116 35th Dr SE Unit C2
- 17116 35th Dr SE Unit A2
- 4620 151st Place SE
- 4624 150th Place SE
- 5 xx 158th St SE
- 4615 150th Place SE
- 4019 171st Place SE
- 15512 Country Club Dr Unit B45
- 15819 35th Dr SE
- 3515 159th Place SE
- 15828 36th Ave SE
- 3521 159th Place SE
- 15824 36th Ave SE
- 15820 36th Ave SE
- 15813 35th Dr SE
- 3526 158th Place SE
- 3527 159th Place SE
- 15816 36th Ave SE
- 3509 159th Place SE
- 15807 35th Dr SE
- 15812 36th Ave SE
- 15921 35th Ave SE
- 15921 35th Dr SE
- 3600 158th Place SE
- 15808 36th Ave SE
- 15914 36th Ave SE
- 15801 35th Dr SE
- 3601 159th Place SE
Your Personal Tour Guide
Ask me questions while you tour the home.