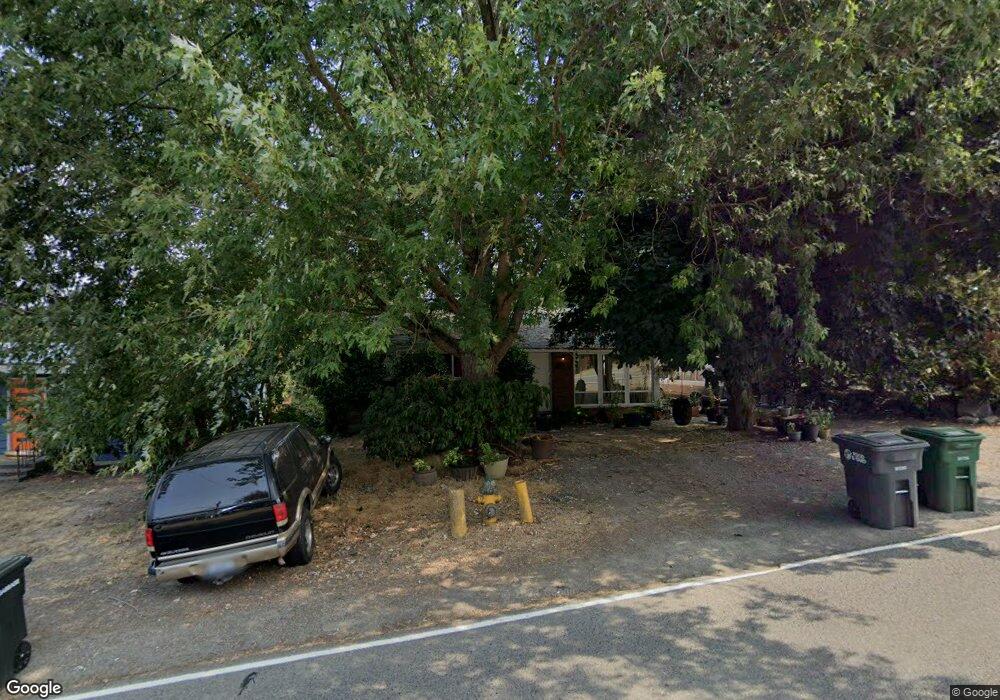
15828 8th Ave SW Burien, WA 98166
Downtown Burien NeighborhoodEstimated Value: $562,982 - $584,000
3
Beds
1
Bath
980
Sq Ft
$587/Sq Ft
Est. Value
About This Home
This home is located at 15828 8th Ave SW, Burien, WA 98166 and is currently estimated at $575,246, approximately $586 per square foot. 15828 8th Ave SW is a home located in King County with nearby schools including Gregory Heights Elementary School, Sylvester Middle School, and Highline High School.
Ownership History
Date
Name
Owned For
Owner Type
Purchase Details
Closed on
Aug 28, 2019
Sold by
Fisher Devin M and Fisher Abby
Bought by
Fisher Devin Mark and Fisher Abby Jaye
Current Estimated Value
Purchase Details
Closed on
Aug 21, 2007
Sold by
Moreland Suzanne E
Bought by
Fisher Devin M and Fisher Abby
Home Financials for this Owner
Home Financials are based on the most recent Mortgage that was taken out on this home.
Original Mortgage
$281,500
Outstanding Balance
$178,959
Interest Rate
6.74%
Mortgage Type
Purchase Money Mortgage
Estimated Equity
$396,287
Purchase Details
Closed on
Sep 7, 1999
Sold by
Tasche Sharon E
Bought by
Moreland Suzanne E
Home Financials for this Owner
Home Financials are based on the most recent Mortgage that was taken out on this home.
Original Mortgage
$112,000
Interest Rate
7.66%
Purchase Details
Closed on
Jun 10, 1997
Sold by
Counts Coco I and Counts Ida C
Bought by
Tasche Sharon E
Home Financials for this Owner
Home Financials are based on the most recent Mortgage that was taken out on this home.
Original Mortgage
$68,950
Interest Rate
7.98%
Create a Home Valuation Report for This Property
The Home Valuation Report is an in-depth analysis detailing your home's value as well as a comparison with similar homes in the area
Home Values in the Area
Average Home Value in this Area
Purchase History
| Date | Buyer | Sale Price | Title Company |
|---|---|---|---|
| Fisher Devin Mark | -- | None Available | |
| Fisher Devin M | $280,000 | Chicago Title | |
| Moreland Suzanne E | $140,000 | Fidelity National Title | |
| Tasche Sharon E | $114,950 | -- |
Source: Public Records
Mortgage History
| Date | Status | Borrower | Loan Amount |
|---|---|---|---|
| Open | Fisher Devin M | $281,500 | |
| Previous Owner | Moreland Suzanne E | $112,000 | |
| Previous Owner | Tasche Sharon E | $68,950 |
Source: Public Records
Tax History Compared to Growth
Tax History
| Year | Tax Paid | Tax Assessment Tax Assessment Total Assessment is a certain percentage of the fair market value that is determined by local assessors to be the total taxable value of land and additions on the property. | Land | Improvement |
|---|---|---|---|---|
| 2024 | $5,692 | $504,000 | $255,000 | $249,000 |
| 2023 | $5,364 | $458,000 | $252,000 | $206,000 |
| 2022 | $5,124 | $485,000 | $252,000 | $233,000 |
| 2021 | $4,709 | $409,000 | $213,000 | $196,000 |
| 2020 | $4,188 | $362,000 | $189,000 | $173,000 |
| 2018 | $3,987 | $306,000 | $153,000 | $153,000 |
| 2017 | $3,285 | $278,000 | $133,000 | $145,000 |
| 2016 | $2,923 | $230,000 | $119,000 | $111,000 |
| 2015 | $2,675 | $211,000 | $109,000 | $102,000 |
| 2014 | -- | $184,000 | $97,000 | $87,000 |
| 2013 | -- | $166,000 | $104,000 | $62,000 |
Source: Public Records
Map
Nearby Homes
- 817 SW 158th St
- 16020 7th Ave SW
- 922 SW 160th St
- 15609 8th Ave SW
- 16056 9th Ave SW Unit B
- 439 SW 156th St
- 16021 11th Ave SW
- 620 SW 155th St
- 15455 10th Ave SW
- 16256 8th Ave SW
- 440 SW 155th St
- 15421 10th Ave SW
- 1017 SW 154th St
- 1307 SW 160th St
- 16433 9th Ave SW
- 15324 4th Ave SW
- 15220 9th Ave SW
- 221 SW 154th St Unit 8
- 16619 Sylvester Rd SW
- 16030 15th Ave SW
- 15820 8th Ave SW
- 15834 8th Ave SW
- 15814 8th Ave SW
- 15836 8th Ave SW
- 15827 7th Ave SW
- 15821 7th Ave SW
- 15810 8th Ave SW
- 15840 8th Ave SW
- 15827 8th Ave SW
- 15815 7th Ave SW
- 15837 7th Ave SW
- 15833 8th Ave SW
- 15821 8th Ave SW
- 15839 8th Ave SW
- 15815 8th Ave SW
- 15843 7th Ave SW
- 709 SW 158th St
- 15802 8th Ave SW
- 15809 8th Ave SW
- 15854 8th Ave SW