Estimated Value: $529,000 - $540,000
4
Beds
2
Baths
1,774
Sq Ft
$301/Sq Ft
Est. Value
About This Home
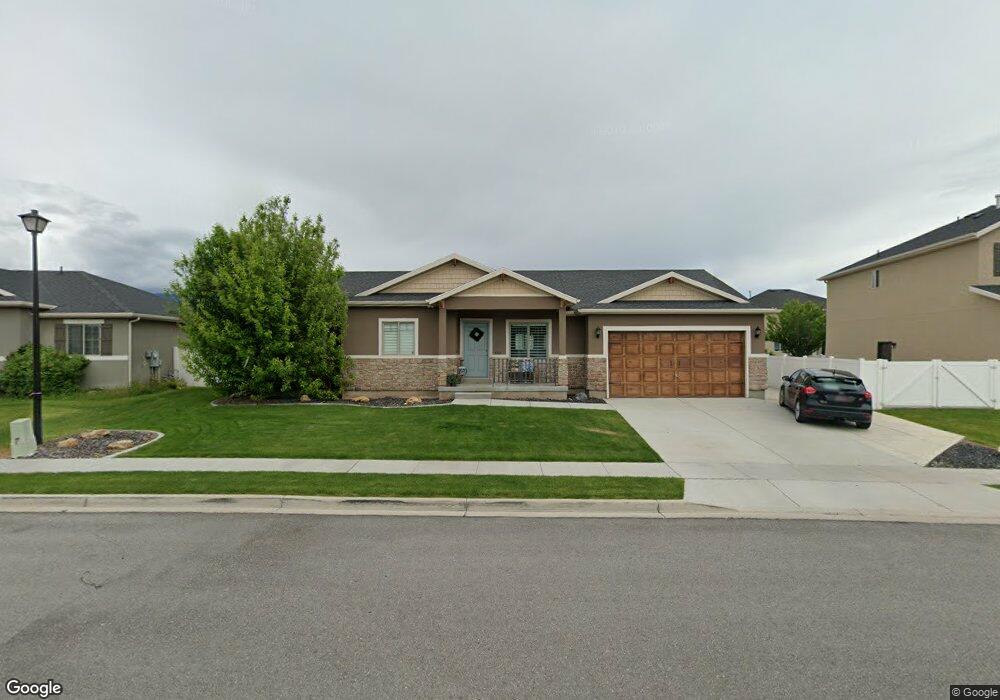
This home is located at 1583 Spring Creek Dr, Lehi, UT 84043 and is currently estimated at $534,369, approximately $301 per square foot. 1583 Spring Creek Dr is a home located in Utah County with nearby schools including Dry Creek Elementary School, Lehi Junior High School, and Lehi High School.
Ownership History
Date
Name
Owned For
Owner Type
Purchase Details
Closed on
May 6, 2020
Sold by
Wing Kristi Dawn and Palmer Kristi Dawn
Bought by
Chamberlain Kenneth D and Chamberlain Julie A
Current Estimated Value
Purchase Details
Closed on
Jul 30, 2015
Sold by
Ratanawan Anna R and Ratanawan Tawan
Bought by
Palmer Kristi Dawn
Home Financials for this Owner
Home Financials are based on the most recent Mortgage that was taken out on this home.
Original Mortgage
$157,400
Interest Rate
3.98%
Mortgage Type
New Conventional
Purchase Details
Closed on
Aug 18, 2009
Sold by
Alpine Homes Inc
Bought by
Ratanawan Anna R and Ratanawan Tawan
Home Financials for this Owner
Home Financials are based on the most recent Mortgage that was taken out on this home.
Original Mortgage
$212,077
Interest Rate
5.17%
Mortgage Type
FHA
Create a Home Valuation Report for This Property
The Home Valuation Report is an in-depth analysis detailing your home's value as well as a comparison with similar homes in the area
Home Values in the Area
Average Home Value in this Area
Purchase History
| Date | Buyer | Sale Price | Title Company |
|---|---|---|---|
| Chamberlain Kenneth D | -- | Investors Title Ins Agcy Inc | |
| Palmer Kristi Dawn | -- | Eagle Gate Title Ins Ag | |
| Ratanawan Anna R | -- | First American Castlewood |
Source: Public Records
Mortgage History
| Date | Status | Borrower | Loan Amount |
|---|---|---|---|
| Previous Owner | Palmer Kristi Dawn | $157,400 | |
| Previous Owner | Ratanawan Anna R | $212,077 |
Source: Public Records
Tax History Compared to Growth
Tax History
| Year | Tax Paid | Tax Assessment Tax Assessment Total Assessment is a certain percentage of the fair market value that is determined by local assessors to be the total taxable value of land and additions on the property. | Land | Improvement |
|---|---|---|---|---|
| 2025 | $2,080 | $258,170 | $186,400 | $283,000 |
| 2024 | $2,080 | $243,430 | $0 | $0 |
| 2023 | $1,960 | $248,985 | $0 | $0 |
| 2022 | $2,176 | $268,015 | $0 | $0 |
| 2021 | $1,957 | $364,400 | $107,900 | $256,500 |
| 2020 | $1,845 | $339,600 | $99,900 | $239,700 |
| 2019 | $1,614 | $308,900 | $99,900 | $209,000 |
| 2018 | $1,530 | $276,800 | $95,100 | $181,700 |
| 2017 | $1,479 | $142,230 | $0 | $0 |
| 2016 | $1,475 | $131,615 | $0 | $0 |
| 2015 | $1,493 | $126,500 | $0 | $0 |
| 2014 | $1,392 | $117,205 | $0 | $0 |
Source: Public Records
Map
Nearby Homes
- Adagio Plan at Grandeur Estates
- Ballad Plan at Grandeur Estates
- Interlude Plan at Grandeur Estates
- Trio Plan at Grandeur Estates
- Forte Plan at Grandeur Estates
- Tenor Plan at Grandeur Estates
- Staccato Plan at Grandeur Estates
- Prelude Plan at Grandeur Estates
- Octave Plan at Grandeur Estates
- Finale Plan at Grandeur Estates
- Harrison Plan at Grandeur Estates
- Crescendo Plan at Grandeur Estates
- Timpani Plan at Grandeur Estates
- Harvard Plan at Grandeur Estates
- Treble Plan at Grandeur Estates
- Browning Plan at Grandeur Estates
- Accord Plan at Grandeur Estates
- Tempo Plan at Grandeur Estates
- Bravo Plan at Grandeur Estates
- Canon Plan at Grandeur Estates
- 1583 S Spring Creek Dr
- 1601 S Spring Creek Dr
- 1601 Spring Creek Dr
- 1567 S Spring Creek Dr
- 1567 S Spring Creek Dr
- 1594 S Bridle Path Loop
- 1594 S Bridle Path
- 1594 S Bridle Path Loop Unit 223
- 1594 S Bridle Path Loop
- 1616 Bridle Path Loop
- 1616 S Bridle Path Loop
- 1572 Bridle Path Loop
- 1572 S Bridle Path Loop
- 1588 S Spring Creek Dr
- 1551 Spring Creek Dr
- 1588 Spring Creek Dr
- 1617 Spring Creek Dr
- 1570 S Spring Creek Dr
- 1570 Spring Creek Dr
- 1550 S Bridle Path Loop