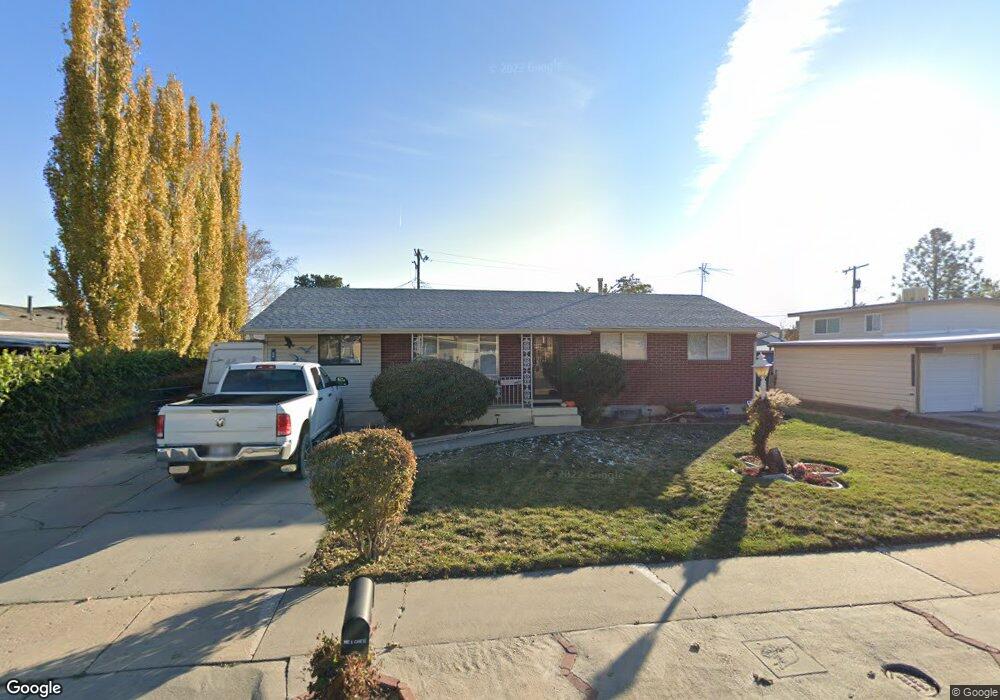
1583 W 1960 N Layton, UT 84041
Estimated Value: $397,601 - $524,000
2
Beds
2
Baths
1,300
Sq Ft
$349/Sq Ft
Est. Value
About This Home
This home is located at 1583 W 1960 N, Layton, UT 84041 and is currently estimated at $453,150, approximately $348 per square foot. 1583 W 1960 N is a home located in Davis County with nearby schools including Vae View Elementary School, North Layton Junior High School, and Northridge High School.
Ownership History
Date
Name
Owned For
Owner Type
Purchase Details
Closed on
Feb 20, 2020
Sold by
Hansen Dolores A and Hansen Troy R
Bought by
Hansen Dolores A and Hansen Troy R
Current Estimated Value
Purchase Details
Closed on
May 14, 2018
Sold by
Hansen Dolores A
Bought by
Hansen Dolores A and Hansen Troy R
Purchase Details
Closed on
Mar 16, 2018
Sold by
Melcher Owen Clark
Bought by
Hansen Dolores A
Purchase Details
Closed on
Oct 24, 2014
Sold by
Melcher Owen C
Bought by
Melcher Owen C and Hansen Dolores A
Purchase Details
Closed on
Aug 31, 1998
Sold by
Woodward Betty L
Bought by
Melcher Owen C and Melcher Betty L
Home Financials for this Owner
Home Financials are based on the most recent Mortgage that was taken out on this home.
Original Mortgage
$75,000
Interest Rate
6.59%
Create a Home Valuation Report for This Property
The Home Valuation Report is an in-depth analysis detailing your home's value as well as a comparison with similar homes in the area
Home Values in the Area
Average Home Value in this Area
Purchase History
| Date | Buyer | Sale Price | Title Company |
|---|---|---|---|
| Hansen Dolores A | -- | None Available | |
| Hansen Dolores A | -- | None Available | |
| Hansen Dolores A | -- | First American Title | |
| Melcher Owen C | -- | None Available | |
| Melcher Owen C | -- | Security Title |
Source: Public Records
Mortgage History
| Date | Status | Borrower | Loan Amount |
|---|---|---|---|
| Previous Owner | Melcher Owen C | $75,000 |
Source: Public Records
Tax History Compared to Growth
Tax History
| Year | Tax Paid | Tax Assessment Tax Assessment Total Assessment is a certain percentage of the fair market value that is determined by local assessors to be the total taxable value of land and additions on the property. | Land | Improvement |
|---|---|---|---|---|
| 2025 | $1,981 | $207,900 | $101,220 | $106,680 |
| 2024 | $1,930 | $204,050 | $120,912 | $83,138 |
| 2023 | $1,878 | $350,000 | $159,270 | $190,730 |
| 2022 | $2,027 | $205,150 | $74,266 | $130,884 |
| 2021 | $1,901 | $287,000 | $105,059 | $181,941 |
| 2020 | $1,609 | $233,000 | $77,048 | $155,952 |
| 2019 | $1,608 | $228,000 | $74,086 | $153,914 |
| 2018 | $1,405 | $200,000 | $68,599 | $131,401 |
| 2016 | $1,208 | $88,716 | $19,850 | $68,866 |
| 2015 | $1,155 | $80,576 | $19,850 | $60,726 |
| 2014 | -- | $90,284 | $19,850 | $70,434 |
| 2013 | -- | $76,475 | $18,612 | $57,863 |
Source: Public Records
Map
Nearby Homes
- 1606 W 1960 N
- 1900 N 1690 W
- 1748 N 1600 W
- 1740 N 1600 W Unit 116
- 1692 N 1600 W
- 1688 N 1600 W Unit 125
- 1682 N 1600 W
- 1650 N Main St Unit 126
- 1678 N 1600 W
- Highbridge 3 Plan at Layton Towns on Main - Townhomes
- Highbridge 1 Plan at Layton Towns on Main - Townhomes
- Midtown Plan at Layton Towns on Main - Townhomes
- Cityline 1 Plan at Layton Towns on Main - Townhomes
- Cityline 2 Plan at Layton Towns on Main - Townhomes
- 1668 N 1600 W
- 1664 N 1600 W
- 1654 N 1600 W
- 1652 N 1600 St W
- 1598 N Main St
- 1425 W 1650 N