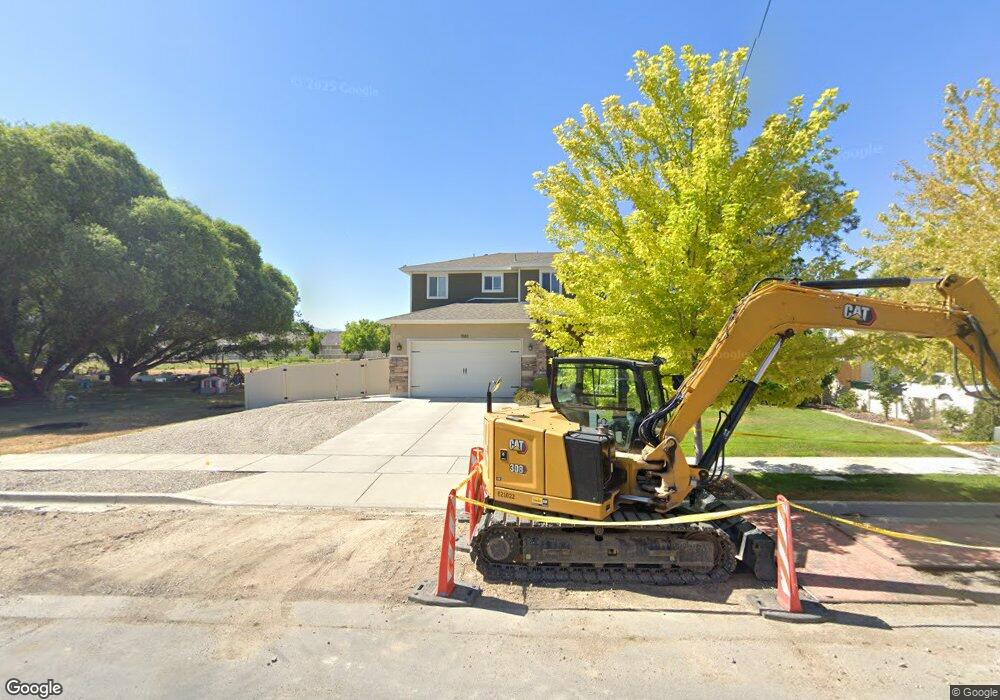
1583 W 8600 S West Jordan, UT 84088
Estimated Value: $573,000 - $630,000
3
Beds
3
Baths
2,663
Sq Ft
$226/Sq Ft
Est. Value
About This Home
This home is located at 1583 W 8600 S, West Jordan, UT 84088 and is currently estimated at $601,962, approximately $226 per square foot. 1583 W 8600 S is a home located in Salt Lake County with nearby schools including Riverside Elementary School, West Jordan Middle School, and West Jordan High School.
Ownership History
Date
Name
Owned For
Owner Type
Purchase Details
Closed on
May 8, 2018
Sold by
Alexander Sean and Alexander Brooke
Bought by
Nelson Ryan and Nelson Chelsea
Current Estimated Value
Home Financials for this Owner
Home Financials are based on the most recent Mortgage that was taken out on this home.
Original Mortgage
$295,200
Outstanding Balance
$254,177
Interest Rate
4.4%
Mortgage Type
New Conventional
Estimated Equity
$347,785
Purchase Details
Closed on
Sep 30, 2014
Sold by
Alexander Sean B and Alexander Brooke A
Bought by
Alexander Sean and Alexander Brooke
Home Financials for this Owner
Home Financials are based on the most recent Mortgage that was taken out on this home.
Original Mortgage
$235,000
Interest Rate
4.07%
Mortgage Type
New Conventional
Purchase Details
Closed on
Nov 25, 2013
Sold by
Robison Dave and Robison Matthew
Bought by
Alexander Sean B and Alexander Brooke A
Home Financials for this Owner
Home Financials are based on the most recent Mortgage that was taken out on this home.
Original Mortgage
$226,000
Interest Rate
4.23%
Mortgage Type
Purchase Money Mortgage
Create a Home Valuation Report for This Property
The Home Valuation Report is an in-depth analysis detailing your home's value as well as a comparison with similar homes in the area
Home Values in the Area
Average Home Value in this Area
Purchase History
| Date | Buyer | Sale Price | Title Company |
|---|---|---|---|
| Nelson Ryan | -- | Meridian Title | |
| Alexander Sean | -- | Eagle Gate Title Ins Agcy | |
| Alexander Sean B | -- | Meridian Title |
Source: Public Records
Mortgage History
| Date | Status | Borrower | Loan Amount |
|---|---|---|---|
| Open | Nelson Ryan | $295,200 | |
| Previous Owner | Alexander Sean | $235,000 | |
| Previous Owner | Alexander Sean B | $226,000 |
Source: Public Records
Tax History Compared to Growth
Tax History
| Year | Tax Paid | Tax Assessment Tax Assessment Total Assessment is a certain percentage of the fair market value that is determined by local assessors to be the total taxable value of land and additions on the property. | Land | Improvement |
|---|---|---|---|---|
| 2025 | $2,957 | $611,600 | $157,200 | $454,400 |
| 2024 | $2,957 | $569,000 | $151,100 | $417,900 |
| 2023 | $3,057 | $554,300 | $149,600 | $404,700 |
| 2022 | $3,127 | $557,800 | $146,700 | $411,100 |
| 2021 | $2,542 | $412,800 | $122,300 | $290,500 |
| 2020 | $2,570 | $391,700 | $122,300 | $269,400 |
| 2019 | $2,520 | $376,600 | $102,700 | $273,900 |
| 2018 | $2,294 | $340,100 | $95,600 | $244,500 |
| 2017 | $2,132 | $314,600 | $95,600 | $219,000 |
| 2016 | $2,108 | $292,300 | $95,600 | $196,700 |
| 2015 | $1,876 | $253,600 | $97,400 | $156,200 |
| 2014 | $896 | $65,600 | $65,600 | $0 |
Source: Public Records
Map
Nearby Homes
- 1633 W Rockaway Ln
- 8534 S Redwood Rd
- 8518 S Redwood Rd
- 1434 Autumn Oak Cir
- 8510 S Redwood Rd
- 1773 W 8760 S
- 8686 S Temple Dr
- 1352 W 8780 S
- 1424 Stone Meadow Dr
- 1689 W 8295 S Unit 2
- 1401 W Stone Meadow Dr
- 1254 W 8680 S
- 2041 W 8820 S
- 8859 S Long Dr
- 1790 W Sugar Factory Rd
- 8383 S 2200 W
- 8155 S Redwood Rd Unit 88
- 8155 S Redwood Rd Unit 142B
- 8155 S Redwood Rd Unit 95
- 8155 S Redwood Rd Unit 28
- 1589 W 8600 S
- 8760 S 1600 W
- 8637 S Eggli Farms Cir Unit 107
- 8637 S Eggli Farms Cir
- 8629 S Eggli Farms Cir
- 8629 S Eggli Farms Cir Unit 106
- 8629 S Eggli Farms Cir
- 8637 S Eggli Farms Cir
- 1577 W 8600 S
- 1608 W 8600 S
- 1588 W 8600 S
- 1621 W 8600 S
- 8643 S Eggli Farms Cir Unit 108
- 8643 S Eggli Farms Cir
- 8643 S Eggli Farms Cir
- 8638 S Eggli Farms Cir Unit 105
- 8638 S Eggli Farms Cir
- 8638 S Eggli Farms Cir
- 1624 W 8600 S
- 8572 S 1600 W