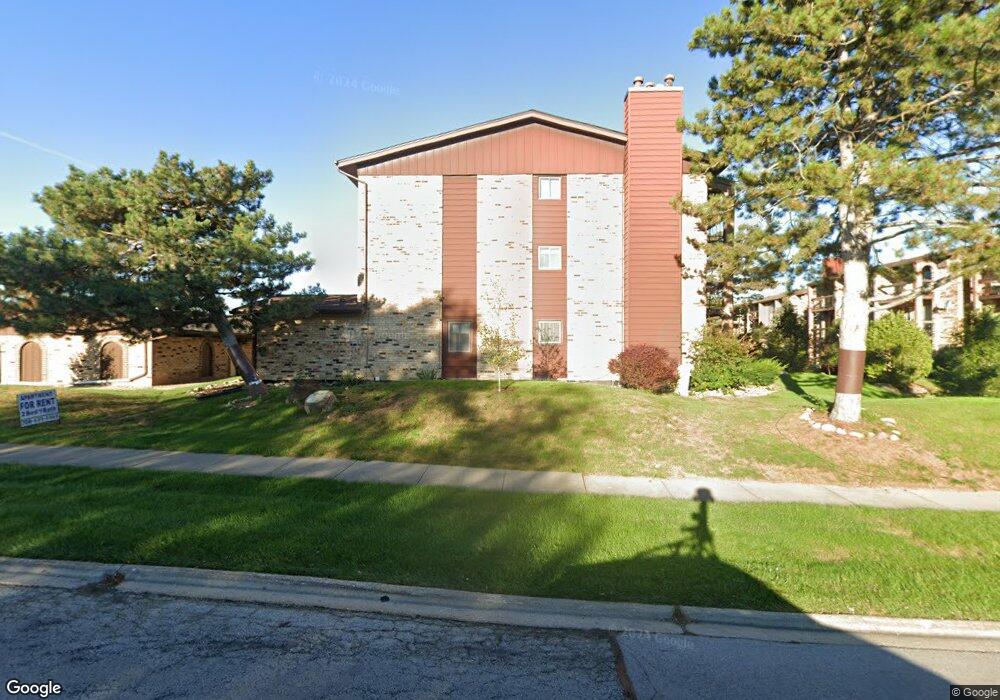
15834 Orlan Brook Dr Unit 1E Orland Park, IL 60462
Silver Lake South NeighborhoodEstimated Value: $167,699 - $225,000
2
Beds
1
Bath
1,000
Sq Ft
$193/Sq Ft
Est. Value
About This Home
This home is located at 15834 Orlan Brook Dr Unit 1E, Orland Park, IL 60462 and is currently estimated at $192,675, approximately $192 per square foot. 15834 Orlan Brook Dr Unit 1E is a home located in Cook County with nearby schools including Prairie Elementary School, Liberty Elementary School, and Jerling Junior High School.
Ownership History
Date
Name
Owned For
Owner Type
Purchase Details
Closed on
Mar 12, 2010
Sold by
Nolan Michael J
Bought by
Nolan Michael J and The Michael J Nolan Declaration Of Trust
Current Estimated Value
Purchase Details
Closed on
Apr 26, 2006
Sold by
Nolan Michael J
Bought by
Nolan Michael J and Decavitch Beth
Home Financials for this Owner
Home Financials are based on the most recent Mortgage that was taken out on this home.
Original Mortgage
$30,000
Interest Rate
6.59%
Mortgage Type
Seller Take Back
Purchase Details
Closed on
Jul 22, 2005
Sold by
Carroll Timothy G
Bought by
Nolan Michael J
Home Financials for this Owner
Home Financials are based on the most recent Mortgage that was taken out on this home.
Original Mortgage
$150,000
Interest Rate
5.66%
Mortgage Type
Unknown
Purchase Details
Closed on
Aug 6, 1999
Sold by
Palos Bank & Trust Company
Bought by
Carroll Timothy G and The Carroll Trust
Purchase Details
Closed on
Jun 30, 1994
Sold by
Mcdonough Edward J and Mcdonough Jarleth M
Bought by
Palos Bank & Trust Company
Create a Home Valuation Report for This Property
The Home Valuation Report is an in-depth analysis detailing your home's value as well as a comparison with similar homes in the area
Home Values in the Area
Average Home Value in this Area
Purchase History
| Date | Buyer | Sale Price | Title Company |
|---|---|---|---|
| Nolan Michael J | -- | None Available | |
| Nolan Michael J | $150,000 | None Available | |
| Nolan Michael J | $150,000 | Pntn | |
| Carroll Timothy G | $127,000 | -- | |
| Palos Bank & Trust Company | -- | -- |
Source: Public Records
Mortgage History
| Date | Status | Borrower | Loan Amount |
|---|---|---|---|
| Previous Owner | Nolan Michael J | $30,000 | |
| Previous Owner | Nolan Michael J | $150,000 |
Source: Public Records
Tax History Compared to Growth
Tax History
| Year | Tax Paid | Tax Assessment Tax Assessment Total Assessment is a certain percentage of the fair market value that is determined by local assessors to be the total taxable value of land and additions on the property. | Land | Improvement |
|---|---|---|---|---|
| 2024 | $2,113 | $11,761 | $823 | $10,938 |
| 2023 | $1,839 | $11,761 | $823 | $10,938 |
| 2022 | $1,839 | $9,559 | $724 | $8,835 |
| 2021 | $1,802 | $9,558 | $724 | $8,834 |
| 2020 | $1,798 | $9,558 | $724 | $8,834 |
| 2019 | $1,682 | $9,556 | $658 | $8,898 |
| 2018 | $1,634 | $9,556 | $658 | $8,898 |
| 2017 | $1,613 | $9,556 | $658 | $8,898 |
| 2016 | $2,118 | $10,086 | $592 | $9,494 |
| 2015 | $2,062 | $10,086 | $592 | $9,494 |
| 2014 | $2,047 | $10,086 | $592 | $9,494 |
| 2013 | $2,200 | $11,213 | $592 | $10,621 |
Source: Public Records
Map
Nearby Homes
- 15826 Orlan Brook Dr Unit 3S
- 15726 Orlan Brook Dr Unit 193
- 15712 86th Ave Unit 117
- 15713 Orlan Brook Dr Unit 98
- 15717 Orlan Brook Dr Unit G83
- 15642 Plum Tree Dr
- 8824 Carnoustie Dr
- 8534 Westberry Ln Unit 8534
- 15636 Chapel Hill Rd
- 8735 Golden Rose Dr
- 8622 Kendall Ln
- 8624 Kendall Ln
- 15633 Orlan Brook Dr
- 16011 84th Place Unit 16011
- 15724 Old Orchard Ct Unit 1W
- 15722 Old Orchard Ct Unit 1E
- 16101 Haven Ave
- 16122 Pine Dr Unit 2476
- 16001 Eagle Ridge Dr Unit 1S
- 16019 Eagle Ridge Dr Unit 2N
- 15834 Orlan Brook Dr Unit 2W
- 15834 Orlan Brook Dr Unit 1W
- 15834 Orlan Brook Dr Unit 2E
- 15834 Orlan Brook Dr Unit 3E
- 15834 Orlan Brook Dr Unit 3W
- 15832 Orlan Brook Dr Unit 1E
- 15832 Orlan Brook Dr
- 15832 Orlan Brook Dr Unit 2W
- 15832 Orlan Brook Dr Unit 3E
- 15832 Orlan Brook Dr Unit 2E
- 15830 Orlan Brook Dr Unit 1A
- 15830 Orlan Brook Dr
- 15830 Orlan Brook Dr Unit 2E
- 15830 Orlan Brook Dr Unit 1B
- 15830 Orlan Brook Dr Unit 2A
- 15830 Orlan Brook Dr Unit 2B
- 8752 W 159th St Unit 2
- 8752 W 159th St Unit 12
- 8752 W 159th St Unit 11
- 8752 W 159th St