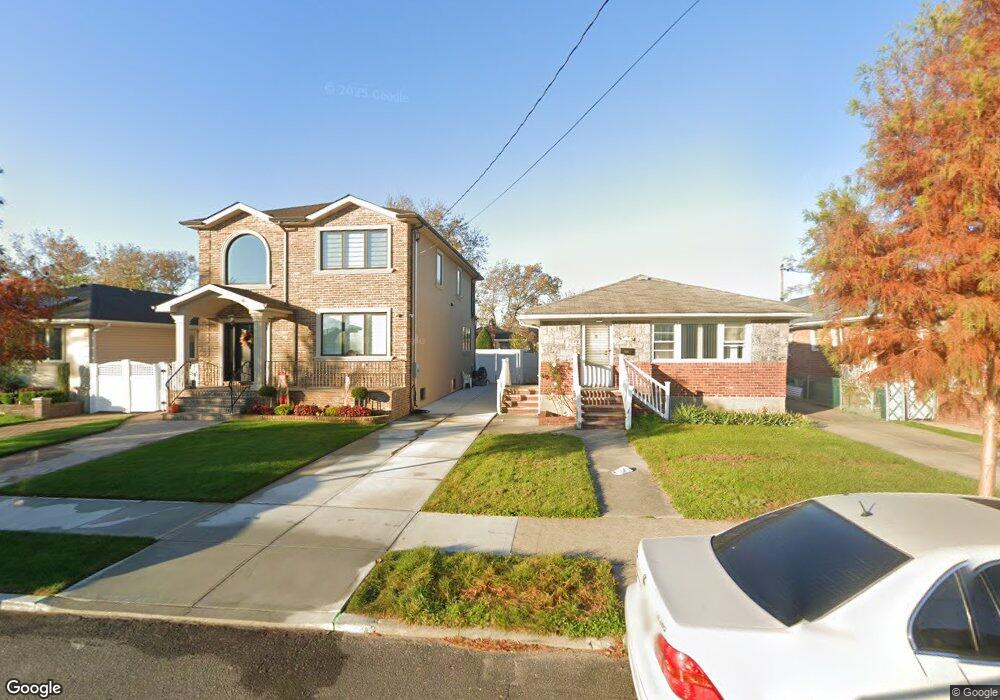
15839 80th St Howard Beach, NY 11414
Howard Beach NeighborhoodEstimated Value: $769,000 - $1,136,000
--
Bed
3
Baths
2,195
Sq Ft
$440/Sq Ft
Est. Value
About This Home
This home is located at 15839 80th St, Howard Beach, NY 11414 and is currently estimated at $965,287, approximately $439 per square foot. 15839 80th St is a home located in Queens County with nearby schools including P.S./M.S. 207 Rockwood Park, Robert H. Goddard High School, and John Adams High School.
Ownership History
Date
Name
Owned For
Owner Type
Purchase Details
Closed on
Jun 30, 2023
Sold by
Pecoraro Christopher
Bought by
Paniagua Eddie and Paniagua Elizabeth
Current Estimated Value
Home Financials for this Owner
Home Financials are based on the most recent Mortgage that was taken out on this home.
Original Mortgage
$627,300
Outstanding Balance
$612,336
Interest Rate
6.79%
Mortgage Type
Purchase Money Mortgage
Estimated Equity
$352,951
Purchase Details
Closed on
Oct 31, 2017
Sold by
Darby Debra
Bought by
Pecoraro Christopher and Pecoraro Patricia
Home Financials for this Owner
Home Financials are based on the most recent Mortgage that was taken out on this home.
Original Mortgage
$451,000
Interest Rate
3.83%
Mortgage Type
New Conventional
Purchase Details
Closed on
Nov 30, 2015
Sold by
Darby Debra and Flaxbaum Debra
Bought by
Darby Debra
Home Financials for this Owner
Home Financials are based on the most recent Mortgage that was taken out on this home.
Original Mortgage
$82,500
Interest Rate
3.89%
Mortgage Type
New Conventional
Create a Home Valuation Report for This Property
The Home Valuation Report is an in-depth analysis detailing your home's value as well as a comparison with similar homes in the area
Home Values in the Area
Average Home Value in this Area
Purchase History
| Date | Buyer | Sale Price | Title Company |
|---|---|---|---|
| Paniagua Eddie | $697,000 | -- | |
| Pecoraro Christopher | $675,000 | -- | |
| Darby Debra | -- | -- |
Source: Public Records
Mortgage History
| Date | Status | Borrower | Loan Amount |
|---|---|---|---|
| Open | Paniagua Eddie | $627,300 | |
| Previous Owner | Pecoraro Christopher | $451,000 | |
| Previous Owner | Darby Debra | $82,500 |
Source: Public Records
Tax History Compared to Growth
Tax History
| Year | Tax Paid | Tax Assessment Tax Assessment Total Assessment is a certain percentage of the fair market value that is determined by local assessors to be the total taxable value of land and additions on the property. | Land | Improvement |
|---|---|---|---|---|
| 2025 | $7,737 | $43,656 | $8,422 | $35,234 |
| 2024 | $7,737 | $38,520 | $9,888 | $28,632 |
| 2023 | $8,009 | $39,874 | $8,279 | $31,595 |
| 2022 | $5,827 | $40,920 | $9,480 | $31,440 |
| 2021 | $5,786 | $41,340 | $9,480 | $31,860 |
| 2020 | $5,404 | $38,040 | $9,480 | $28,560 |
| 2019 | $5,321 | $37,380 | $9,480 | $27,900 |
| 2018 | $6,774 | $33,228 | $7,211 | $26,017 |
| 2017 | $6,390 | $31,348 | $7,643 | $23,705 |
| 2016 | $5,912 | $31,348 | $7,643 | $23,705 |
| 2015 | $2,273 | $27,900 | $10,560 | $17,340 |
| 2014 | $2,273 | $27,900 | $10,560 | $17,340 |
Source: Public Records
Map
Nearby Homes
- 15844 79th St
- 158-40 81st St
- 159-23 79th St
- 158-35 78th St
- 159-42 81st St
- 158-38 84th St
- 160-14 83rd St
- 81-03 161st Ave
- 8011 Shore Pkwy Unit 287
- 15649 77th St
- 159-44 85th St
- 80-35 Shore Pkwy Unit 274
- 160-46 84th St
- 156-17 78th St Unit 2
- 156-15 78th St
- 156-11 78th St
- 156-40 76th St
- 80-10 156th Ave Unit 223
- 80-65 Shore Pkwy Unit 254
- 160-38 85th St