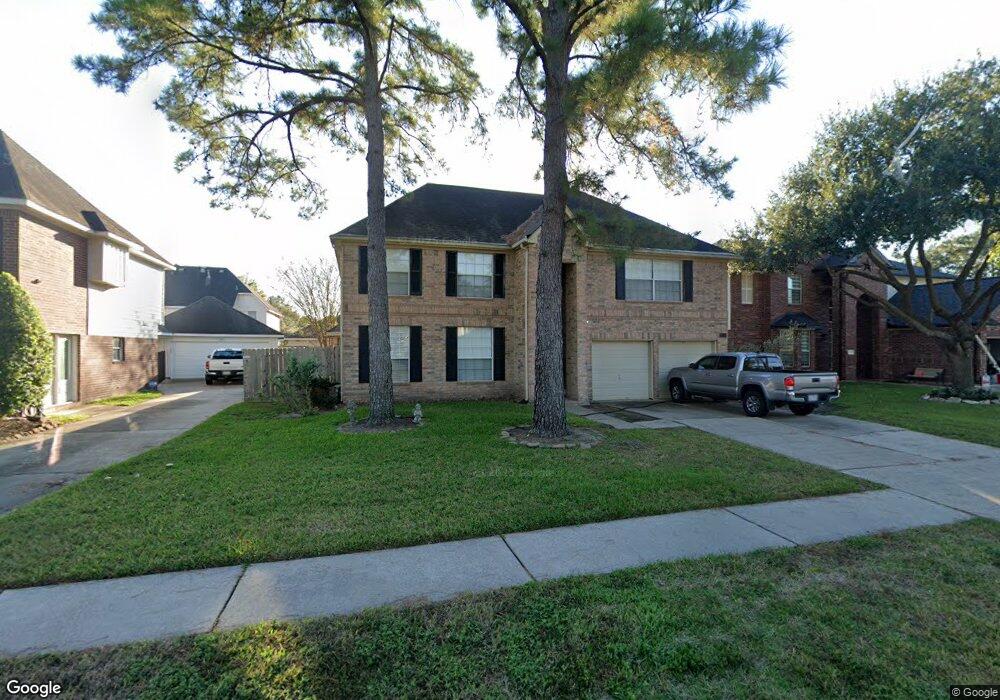
15843 Aberdeen Trails Dr Houston, TX 77095
Estimated Value: $338,000 - $354,000
4
Beds
3
Baths
2,321
Sq Ft
$149/Sq Ft
Est. Value
About This Home
This home is located at 15843 Aberdeen Trails Dr, Houston, TX 77095 and is currently estimated at $345,874, approximately $149 per square foot. 15843 Aberdeen Trails Dr is a home located in Harris County with nearby schools including Fiest Elementary School, Labay Middle School, and Cypress Falls High School.
Ownership History
Date
Name
Owned For
Owner Type
Purchase Details
Closed on
Dec 30, 2015
Sold by
Quist Jo Ann
Bought by
Martinez Imelda Castillo
Current Estimated Value
Purchase Details
Closed on
Nov 3, 2009
Sold by
Quist Jo Ann
Bought by
Quist Jo Ann and Jo Ann Quist Revocable Trust
Purchase Details
Closed on
Apr 21, 2009
Sold by
Quist Jo
Bought by
Quist Jo
Purchase Details
Closed on
May 8, 2002
Sold by
Moss Irvin W and Moss Irmgard A
Bought by
Moss Irvin W and Moss Irmgard A
Purchase Details
Closed on
May 27, 1994
Sold by
Brighton Builders Inc
Bought by
Quist Charles A
Home Financials for this Owner
Home Financials are based on the most recent Mortgage that was taken out on this home.
Original Mortgage
$99,200
Interest Rate
8.45%
Create a Home Valuation Report for This Property
The Home Valuation Report is an in-depth analysis detailing your home's value as well as a comparison with similar homes in the area
Home Values in the Area
Average Home Value in this Area
Purchase History
| Date | Buyer | Sale Price | Title Company |
|---|---|---|---|
| Martinez Imelda Castillo | -- | Great American Title Co | |
| Quist Jo Ann | -- | None Available | |
| Quist Jo | -- | None Available | |
| Moss Irvin W | -- | -- | |
| Quist Charles A | -- | Title Agency #28 |
Source: Public Records
Mortgage History
| Date | Status | Borrower | Loan Amount |
|---|---|---|---|
| Previous Owner | Quist Charles A | $99,200 |
Source: Public Records
Tax History Compared to Growth
Tax History
| Year | Tax Paid | Tax Assessment Tax Assessment Total Assessment is a certain percentage of the fair market value that is determined by local assessors to be the total taxable value of land and additions on the property. | Land | Improvement |
|---|---|---|---|---|
| 2025 | $1,279 | $309,428 | $70,371 | $239,057 |
| 2024 | $1,279 | $297,728 | $70,371 | $227,357 |
| 2023 | $1,279 | $346,933 | $70,371 | $276,562 |
| 2022 | $6,424 | $275,107 | $58,519 | $216,588 |
| 2021 | $6,181 | $238,571 | $58,519 | $180,052 |
| 2020 | $5,924 | $219,469 | $41,852 | $177,617 |
| 2019 | $5,771 | $207,525 | $38,149 | $169,376 |
| 2018 | $278 | $201,171 | $38,149 | $163,022 |
| 2017 | $5,625 | $201,171 | $38,149 | $163,022 |
| 2016 | $6,171 | $220,679 | $38,149 | $182,530 |
| 2015 | $4,824 | $220,679 | $38,149 | $182,530 |
| 2014 | $4,824 | $167,855 | $34,815 | $133,040 |
Source: Public Records
Map
Nearby Homes
- 15802 Aberdeen Trails Dr
- 15906 Marwick Ct
- 9138 Shango Ln
- 8818 Apple Mill Dr
- 9111 Sunny Ridge Dr
- 15735 Jamie Lee Dr
- 8814 Sherina Park Dr
- 9303 Reston Grove Ln
- 15627 Kentwater Ct
- 15610 Manorford Ct
- 16111 Aberdeen Forest Dr
- 16123 Aberdeen Forest Dr
- 8526 Greenleaf Lake Dr
- 15610 Tarpon Springs Ct
- 15634 Haleys Landing Ln
- 15954 Oak Mountain Dr
- 16211 Green Smoke Dr
- 8550 Sparkling Springs Dr
- 8835 Aberdeen Park Dr
- 8306 Lake Crystal Dr
- 15839 Aberdeen Trails Dr
- 15847 Aberdeen Trails Dr
- 15842 Red Hill Trail
- 8931 Apple Mill Dr
- 15835 Aberdeen Trails Dr
- 15838 Red Hill Trail
- 15842 Aberdeen Trails Dr
- 15846 Aberdeen Trails Dr
- 15831 Aberdeen Trails Dr
- 15834 Aberdeen Trails Dr
- 8922 Bonnyview Dr
- 8918 Bonnyview Dr
- 15834 Red Hill Trail
- 8914 Bonnyview Dr
- 8923 Apple Mill Dr
- 15830 Aberdeen Trails Dr
- 9002 Bonnyview Dr
- 15831 Sweetrose Place
- 8910 Bonnyview Dr
- 9103 Shango Ln