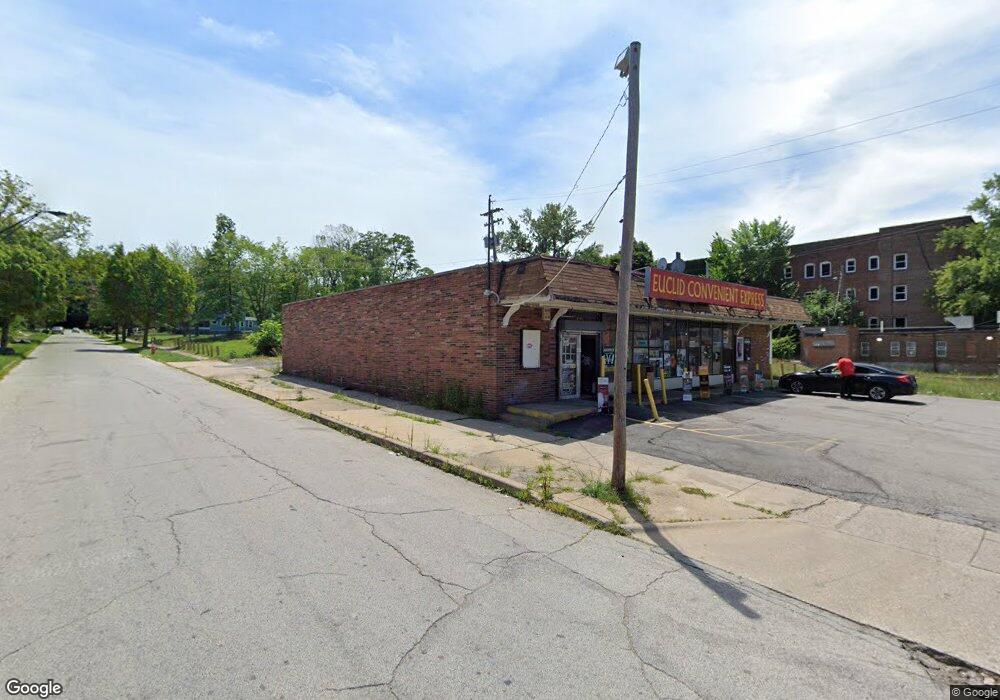
15848 Euclid Ave East Cleveland, OH 44112
Estimated Value: $299,416
--
Bed
--
Bath
3,450
Sq Ft
$87/Sq Ft
Est. Value
About This Home
This home is located at 15848 Euclid Ave, East Cleveland, OH 44112 and is currently priced at $299,416, approximately $86 per square foot. 15848 Euclid Ave is a home located in Cuyahoga County with nearby schools including A.C. Jones Health Professions Magnet Academy, Shaw High School, and Apex Academy.
Ownership History
Date
Name
Owned For
Owner Type
Purchase Details
Closed on
Feb 6, 2023
Sold by
Verma Narinder K and Verma Sunita
Bought by
Hussain Adel Ali and Hussain Kaseem Abdulfatah
Current Estimated Value
Purchase Details
Closed on
Sep 13, 2004
Sold by
River Nile Services Inc
Bought by
Verma Narinder K and Verma Sunita
Purchase Details
Closed on
Dec 2, 1999
Sold by
Burkons Jerome
Bought by
River Nile Services Inc
Home Financials for this Owner
Home Financials are based on the most recent Mortgage that was taken out on this home.
Original Mortgage
$145,000
Interest Rate
7.87%
Mortgage Type
Seller Take Back
Purchase Details
Closed on
Nov 8, 1989
Sold by
Burkons Lenore
Bought by
Burkons Jerome
Purchase Details
Closed on
Jun 17, 1988
Sold by
Burkons Jerome B
Bought by
Burkons Lenore
Purchase Details
Closed on
Jan 1, 1975
Bought by
Burkons Jerome B
Create a Home Valuation Report for This Property
The Home Valuation Report is an in-depth analysis detailing your home's value as well as a comparison with similar homes in the area
Home Values in the Area
Average Home Value in this Area
Purchase History
| Date | Buyer | Sale Price | Title Company |
|---|---|---|---|
| Hussain Adel Ali | $90,000 | Chicago Title | |
| Verma Narinder K | $195,000 | Real Estate Title | |
| River Nile Services Inc | $185,000 | -- | |
| Burkons Jerome | -- | -- | |
| Burkons Lenore | -- | -- | |
| Burkons Jerome B | -- | -- |
Source: Public Records
Mortgage History
| Date | Status | Borrower | Loan Amount |
|---|---|---|---|
| Previous Owner | River Nile Services Inc | $145,000 |
Source: Public Records
Tax History Compared to Growth
Tax History
| Year | Tax Paid | Tax Assessment Tax Assessment Total Assessment is a certain percentage of the fair market value that is determined by local assessors to be the total taxable value of land and additions on the property. | Land | Improvement |
|---|---|---|---|---|
| 2024 | $4,204 | $40,145 | $7,980 | $32,165 |
| 2023 | $5,949 | $52,820 | $7,980 | $44,840 |
| 2022 | $5,957 | $52,820 | $7,980 | $44,840 |
| 2021 | $5,946 | $52,820 | $7,980 | $44,840 |
| 2020 | $6,266 | $52,820 | $7,980 | $44,840 |
| 2019 | $6,709 | $150,900 | $22,800 | $128,100 |
| 2018 | $7,038 | $52,820 | $7,980 | $44,840 |
| 2017 | $7,471 | $56,770 | $14,490 | $42,280 |
| 2016 | $7,400 | $56,770 | $14,490 | $42,280 |
| 2015 | $7,475 | $56,770 | $14,490 | $42,280 |
| 2014 | $7,475 | $62,380 | $15,930 | $46,450 |
Source: Public Records
Map
Nearby Homes
- 1854 Hastings Ave
- 1731 Taylor Rd
- 1851 Sheldon Ave
- 1770 Alcoy Rd
- 1762 Alcoy Rd
- 14725 Elm Ave
- 14705 Alder Ave
- 14810 Shaw Ave
- 14615 Elm Ave
- 1816 Lampson Rd
- 1872 Lampson Rd
- 14744 Wemple Rd
- 1369 Hampton Rd
- 14500 Alder Ave
- 1875 Lampson Rd
- 1141 E 148th St
- 15018 Terrace Rd
- 935 Ravine Dr
- 14720 Coit Rd
- 861 Caledonia Ave
- 15908 Euclid Ave
- 1817 Allandale Ave
- 15924 Euclid Ave
- 1828 Allandale Ave
- 15901 Euclid Ave
- 1817 Burnette Ave
- 15936 Euclid Ave
- 1821 Burnette Ave
- 1829 Allandale Ave
- 1832 Allandale Ave
- 1825 Burnette Ave
- 15933 Euclid Ave
- 1833 Allandale Ave
- 15933 Euclid 12bc Ave
- 15933 Euclid 12bo Ave
- 1829 Burnette Ave
- 1838 Allandale Ave
- 1837 Allandale Ave
- 1831 Burnette Ave
- 15929 Euclid Ave