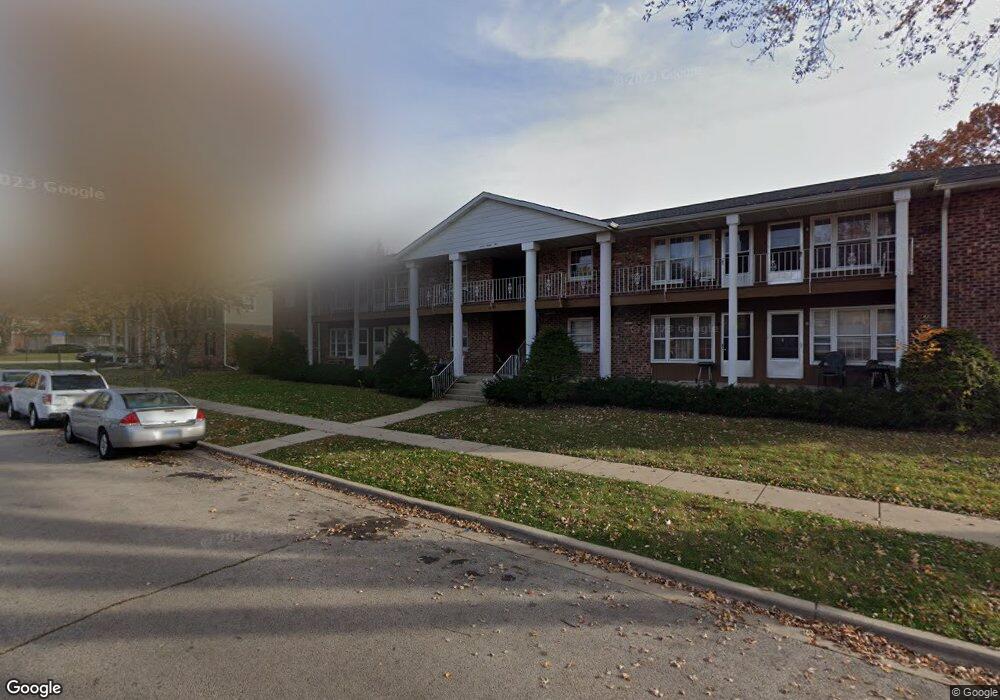
1585 Maple Ln Elgin, IL 60123
North Country Knolls NeighborhoodEstimated Value: $868,000
14
Beds
7
Baths
7,110
Sq Ft
$122/Sq Ft
Est. Value
About This Home
This home is located at 1585 Maple Ln, Elgin, IL 60123 and is currently estimated at $868,000, approximately $122 per square foot. 1585 Maple Ln is a home located in Kane County with nearby schools including Hillcrest Elementary School, Kimball Middle School, and Larkin High School.
Ownership History
Date
Name
Owned For
Owner Type
Purchase Details
Closed on
Mar 13, 2018
Sold by
Dorio Michele
Bought by
Sanya Realty Llc
Current Estimated Value
Home Financials for this Owner
Home Financials are based on the most recent Mortgage that was taken out on this home.
Original Mortgage
$642,782
Interest Rate
4.38%
Mortgage Type
Commercial
Purchase Details
Closed on
Sep 26, 2008
Sold by
Hendricks Donald R
Bought by
Dorio Pete R and Dorio Michele E
Home Financials for this Owner
Home Financials are based on the most recent Mortgage that was taken out on this home.
Original Mortgage
$375,000
Interest Rate
3.5%
Mortgage Type
Future Advance Clause Open End Mortgage
Purchase Details
Closed on
Nov 28, 2006
Sold by
Hendricks Donald R and Hendricks Judith Lee
Bought by
Hendricks Donald R and Donald R Hendricks Trust
Purchase Details
Closed on
Aug 13, 2002
Sold by
Hendricks Donald R and Hendricks Judith G
Bought by
Hendricks Donald R and Hendricks Judith Lee
Purchase Details
Closed on
Sep 8, 2000
Sold by
Lasalle Bank National Assn
Bought by
Hendricks Donald R and Hendricks Judith L
Create a Home Valuation Report for This Property
The Home Valuation Report is an in-depth analysis detailing your home's value as well as a comparison with similar homes in the area
Home Values in the Area
Average Home Value in this Area
Purchase History
| Date | Buyer | Sale Price | Title Company |
|---|---|---|---|
| Sanya Realty Llc | $520,000 | Attorneys Title Guaranty Fun | |
| Dorio Michele | -- | Attorneys Title Guaranty Fun | |
| Dorio Pete R | $635,000 | Attorneys Title Guaranty Fun | |
| Hendricks Donald R | -- | None Available | |
| Hendricks Donald R | -- | -- | |
| Hendricks Donald R | -- | -- | |
| Hendricks Donald R | $283,500 | -- |
Source: Public Records
Mortgage History
| Date | Status | Borrower | Loan Amount |
|---|---|---|---|
| Closed | Sanya Realty Llc | $642,782 | |
| Previous Owner | Dorio Pete R | $375,000 |
Source: Public Records
Tax History
| Year | Tax Paid | Tax Assessment Tax Assessment Total Assessment is a certain percentage of the fair market value that is determined by local assessors to be the total taxable value of land and additions on the property. | Land | Improvement |
|---|---|---|---|---|
| 2024 | $20,647 | $257,990 | $47,106 | $210,884 |
| 2023 | $19,869 | $233,075 | $42,557 | $190,518 |
| 2022 | $18,428 | $212,524 | $38,805 | $173,719 |
| 2021 | $17,727 | $198,695 | $36,280 | $162,415 |
| 2020 | $17,300 | $189,685 | $34,635 | $155,050 |
| 2019 | $16,876 | $180,687 | $32,992 | $147,695 |
| 2018 | $16,829 | $170,219 | $31,081 | $139,138 |
| 2017 | $17,608 | $171,190 | $31,259 | $139,931 |
| 2016 | $18,476 | $173,242 | $29,000 | $144,242 |
| 2015 | -- | $158,792 | $26,581 | $132,211 |
| 2014 | -- | $156,832 | $26,253 | $130,579 |
| 2013 | -- | $160,969 | $26,946 | $134,023 |
Source: Public Records
Map
Nearby Homes
- 221 Heine Ave
- 1849 Larkin Ave
- 308 N Clifton Ave
- 1455 Erie St
- 70 S Weston Ave
- 1840 W Highland Ave Unit E-105
- 1059 Larkin Ave
- 92 N Airlite St
- 1017 W Highland Ave
- 136 Mckinstry Dr
- 302 Hubbard Ave
- 262 S Weston Ave
- 356 N Airlite St Unit 356
- 530 Cumberland Trail
- 527 N Lyle Ave
- 2022 Torino Dr
- 512 Shenandoah Trail
- 44 Monroe St
- 10N836 Maple St
- 1419 Harlan Ave
- 57 N Jane Dr
- 1559 Maple Ln
- 58 Surrey Dr Unit 5
- 1572 Maple Ln
- 101-103 N Jane Dr
- 101 N Jane Dr Unit 103
- 53 N Jane Dr
- 53 N Jane Dr Unit 3
- 53 N Jane Dr Unit 1
- 1570 Maple Ln Unit 72
- 64 N Jane Dr
- 52 Surrey Dr Unit 5
- 52 Surrey Dr
- 1556 Maple Ln Unit 58
- 58 N Jane Dr
- 47 N Jane Dr
- 1542 Maple Ln Unit 44
- 102 N Jane Dr Unit 4
- 104 N Jane Dr
- 61 Surrey Dr
Your Personal Tour Guide
Ask me questions while you tour the home.