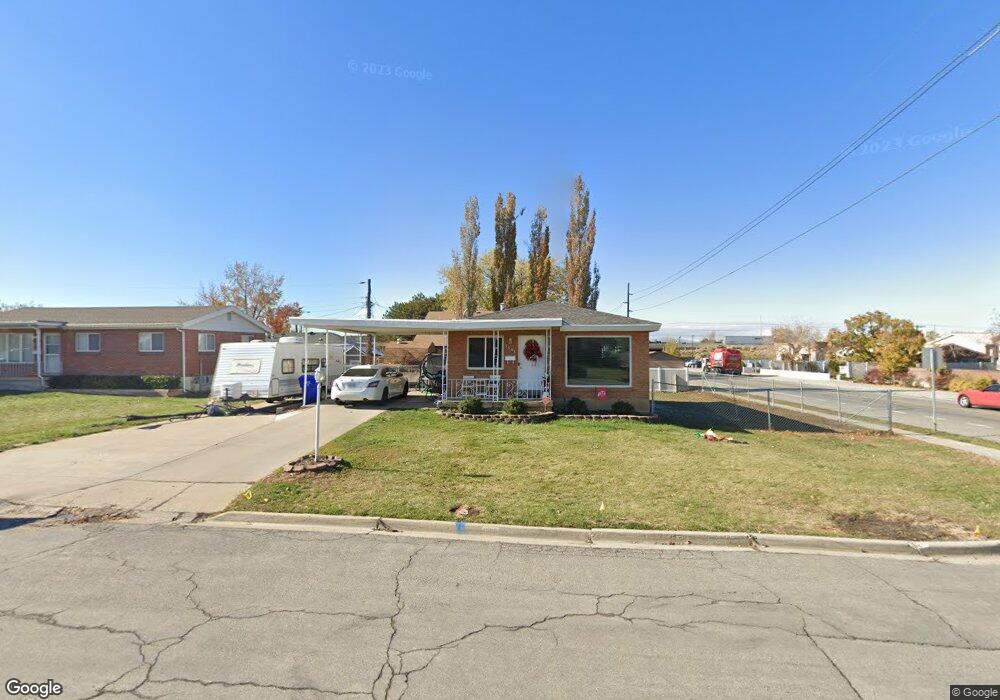
1585 N 350 W Bountiful, UT 84010
Estimated Value: $429,000 - $510,000
5
Beds
3
Baths
2,100
Sq Ft
$227/Sq Ft
Est. Value
About This Home
This home is located at 1585 N 350 W, Bountiful, UT 84010 and is currently estimated at $476,140, approximately $226 per square foot. 1585 N 350 W is a home located in Davis County with nearby schools including Meadowbrook Elementary School, Bountiful Junior High School, and Viewmont High School.
Ownership History
Date
Name
Owned For
Owner Type
Purchase Details
Closed on
Feb 25, 2016
Sold by
Thurston Tyler
Bought by
Thurston Tyler and Thurston Kristen M
Current Estimated Value
Purchase Details
Closed on
Aug 25, 2003
Sold by
Jenson Brad L and Jenson Jennifer
Bought by
Jenson Brad L and Jenson Jennifer L
Home Financials for this Owner
Home Financials are based on the most recent Mortgage that was taken out on this home.
Original Mortgage
$111,044
Interest Rate
5.6%
Mortgage Type
FHA
Purchase Details
Closed on
Jan 29, 1996
Sold by
Gallegos Peter L and Gallegos Angela D
Bought by
Jenson Brad L and Jenson Jennifer
Home Financials for this Owner
Home Financials are based on the most recent Mortgage that was taken out on this home.
Original Mortgage
$106,139
Interest Rate
7.25%
Mortgage Type
FHA
Create a Home Valuation Report for This Property
The Home Valuation Report is an in-depth analysis detailing your home's value as well as a comparison with similar homes in the area
Home Values in the Area
Average Home Value in this Area
Purchase History
| Date | Buyer | Sale Price | Title Company |
|---|---|---|---|
| Thurston Tyler | -- | Backman Title Services | |
| Thurston Tyler | -- | Us Title Company Of Utah | |
| Jenson Brad L | -- | Aspen Title Insurance Agency | |
| Jenson Brad L | -- | First American Title Co |
Source: Public Records
Mortgage History
| Date | Status | Borrower | Loan Amount |
|---|---|---|---|
| Previous Owner | Jenson Brad L | $111,044 | |
| Previous Owner | Jenson Brad L | $106,139 |
Source: Public Records
Tax History Compared to Growth
Tax History
| Year | Tax Paid | Tax Assessment Tax Assessment Total Assessment is a certain percentage of the fair market value that is determined by local assessors to be the total taxable value of land and additions on the property. | Land | Improvement |
|---|---|---|---|---|
| 2025 | $2,910 | $227,700 | $121,170 | $106,530 |
| 2024 | $2,620 | $218,900 | $106,958 | $111,942 |
| 2023 | $2,574 | $390,000 | $198,033 | $191,967 |
| 2022 | $2,743 | $223,300 | $108,475 | $114,825 |
| 2021 | $2,311 | $318,000 | $141,911 | $176,089 |
| 2020 | $2,076 | $259,000 | $121,579 | $137,421 |
| 2019 | $2,118 | $272,000 | $130,843 | $141,157 |
| 2018 | $1,680 | $229,000 | $128,314 | $100,686 |
| 2016 | $1,442 | $106,315 | $44,631 | $61,684 |
| 2015 | $1,414 | $98,395 | $44,991 | $53,404 |
| 2014 | $1,457 | $104,903 | $44,991 | $59,912 |
| 2013 | -- | $99,331 | $28,952 | $70,379 |
Source: Public Records
Map
Nearby Homes
- Lincoln Farmhouse Plan at Belmont Farms
- Belmont Traditional Plan at Belmont Farms
- Hampton Traditional Plan at Belmont Farms
- 239 Lyman Ln
- 1552 N 200 W
- 234 Leah Cir
- 204 Lyman Ln
- 235 W 1400 N
- 1410 N 200 W
- 548 S 675 W
- 420 Rawlins Cir
- 1260 N 200 W
- 637 W 1600 N
- 1194 N 200 W
- 366 W 1000 N
- 324 S 600 W
- 29 W Lady Ln
- 184 Park Shadows Cir
- 353 Florentine Ln
- 63 E 820 S
- 1563 N 350 W
- 1584 N 400 W
- 1562 N 400 W
- 1584 N 350 W
- 1551 N 350 W
- 1562 N 350 W
- 1621 Pages Place Dr
- 1550 N 400 W
- 1621 Pages Place
- 1613 Pages Place Dr
- 1626 Pages Place
- 1617 Pages Place
- 1617 Pages Place Dr
- 1613 Pages Place
- 1625 Pages Place Dr
- 1625 Pages Place
- 1550 N 350 W
- 1630 Pages Place
- 408 W Pages Ln
- 1630 Pages Place Dr