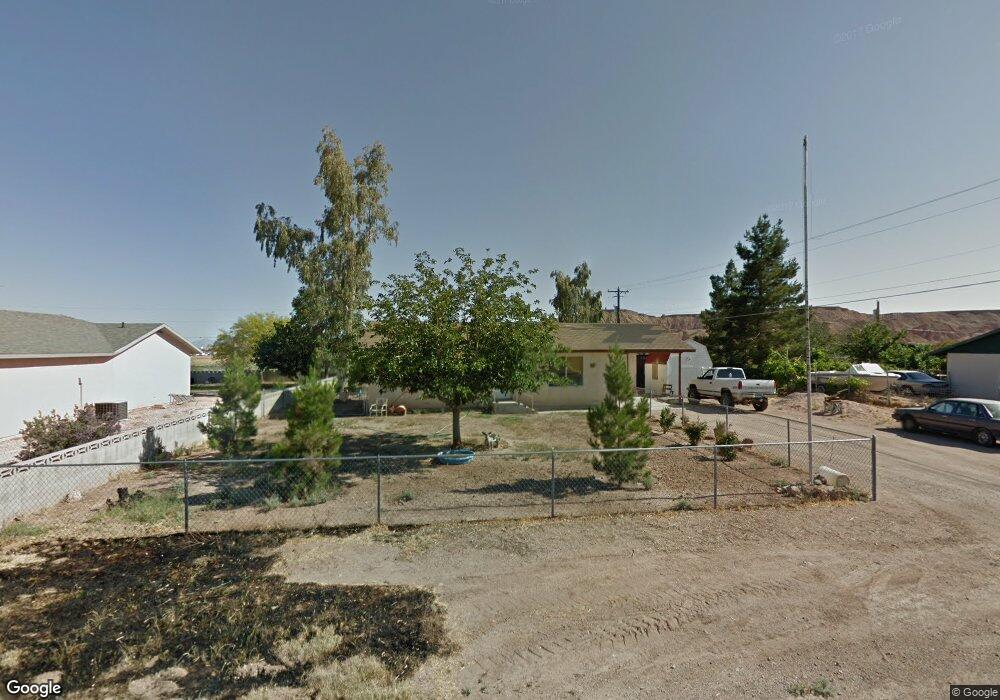
1585 Navajo Ave Logandale, NV 89021
Estimated Value: $243,573 - $336,000
2
Beds
1
Bath
1,061
Sq Ft
$256/Sq Ft
Est. Value
About This Home
This home is located at 1585 Navajo Ave, Logandale, NV 89021 and is currently estimated at $271,393, approximately $255 per square foot. 1585 Navajo Ave is a home with nearby schools including Grant Bowler Elementary School, Mack Lyon Middle School, and Moapa Valley High School.
Ownership History
Date
Name
Owned For
Owner Type
Purchase Details
Closed on
Sep 24, 2010
Sold by
Blackwell Shadd A and Blackwell Crystal R
Bought by
Blackwell Crystal R and Blackwell Shadd A
Current Estimated Value
Home Financials for this Owner
Home Financials are based on the most recent Mortgage that was taken out on this home.
Original Mortgage
$158,881
Outstanding Balance
$106,552
Interest Rate
4.75%
Mortgage Type
FHA
Estimated Equity
$164,841
Purchase Details
Closed on
Aug 29, 2005
Sold by
Vincent David G and Waldhalm Natasha A
Bought by
Blackwell Shadd and Talbot Crystal
Home Financials for this Owner
Home Financials are based on the most recent Mortgage that was taken out on this home.
Original Mortgage
$165,404
Interest Rate
5.76%
Mortgage Type
FHA
Create a Home Valuation Report for This Property
The Home Valuation Report is an in-depth analysis detailing your home's value as well as a comparison with similar homes in the area
Home Values in the Area
Average Home Value in this Area
Purchase History
| Date | Buyer | Sale Price | Title Company |
|---|---|---|---|
| Blackwell Crystal R | -- | Equity Title Of Nevada | |
| Blackwell Shadd | $168,000 | Fidelity National Title |
Source: Public Records
Mortgage History
| Date | Status | Borrower | Loan Amount |
|---|---|---|---|
| Open | Blackwell Crystal R | $158,881 | |
| Closed | Blackwell Shadd | $165,404 |
Source: Public Records
Tax History Compared to Growth
Tax History
| Year | Tax Paid | Tax Assessment Tax Assessment Total Assessment is a certain percentage of the fair market value that is determined by local assessors to be the total taxable value of land and additions on the property. | Land | Improvement |
|---|---|---|---|---|
| 2025 | $680 | $37,680 | $13,965 | $23,715 |
| 2024 | $661 | $37,680 | $13,965 | $23,715 |
| 2023 | $661 | $34,284 | $11,550 | $22,734 |
| 2022 | $643 | $31,555 | $10,588 | $20,967 |
| 2021 | $625 | $30,180 | $9,975 | $20,205 |
| 2020 | $583 | $30,297 | $9,975 | $20,322 |
| 2019 | $566 | $29,787 | $9,625 | $20,162 |
| 2018 | $550 | $28,247 | $8,750 | $19,497 |
| 2017 | $724 | $28,640 | $8,750 | $19,890 |
| 2016 | $544 | $25,172 | $7,875 | $17,297 |
| 2015 | $543 | $19,947 | $7,875 | $12,072 |
| 2014 | $528 | $20,136 | $7,875 | $12,261 |
Source: Public Records
Map
Nearby Homes
- 1917 N Moapa Valley Blvd
- 1625 Metcalf Dr
- 0 Moapa Valley
- 985 Hinckley Ave
- 2770 Taylor St
- 1635 Zubia St
- 1 N Heyer St
- 0 N Heyer St
- 2925 Rice St
- 1470 St Joseph St
- 0 0 Ash and Diane Unit 2681485
- 2030 Ash St
- 921 Gubler Ave
- 0 N Yamashita St
- 1141 Thomas Bay Cir
- 0 Willow Ave
- 1990 Liston Ave
- 0 Diane Ave
- 285 Pat Ave
- 0 Lou St
- 1575 N Navajo Ave
- 1595 Navajo Ave
- 1565 Navajo Ave
- 1605 Navajo Ave
- 1545 Navajo Ave
- 1625 Navajo Ave
- 1645 Navajo Ave
- 1525 Navajo Ave
- 2050 N Moapa Valley Blvd
- 2080 N Moapa Valley Blvd
- 2010 N Moapa Valley Blvd
- 2030 N Moapa Valley Blvd
- 2250 E Pueblo St
- 2040 N Moapa Valley Blvd
- 1615 Anasazi Ave
- 2260 Pueblo St
- 1545 Anasazi Ave
- 1625 Anasazi Ave
- 1635 Anasazi Ave
- 1645 Anasazi Ave