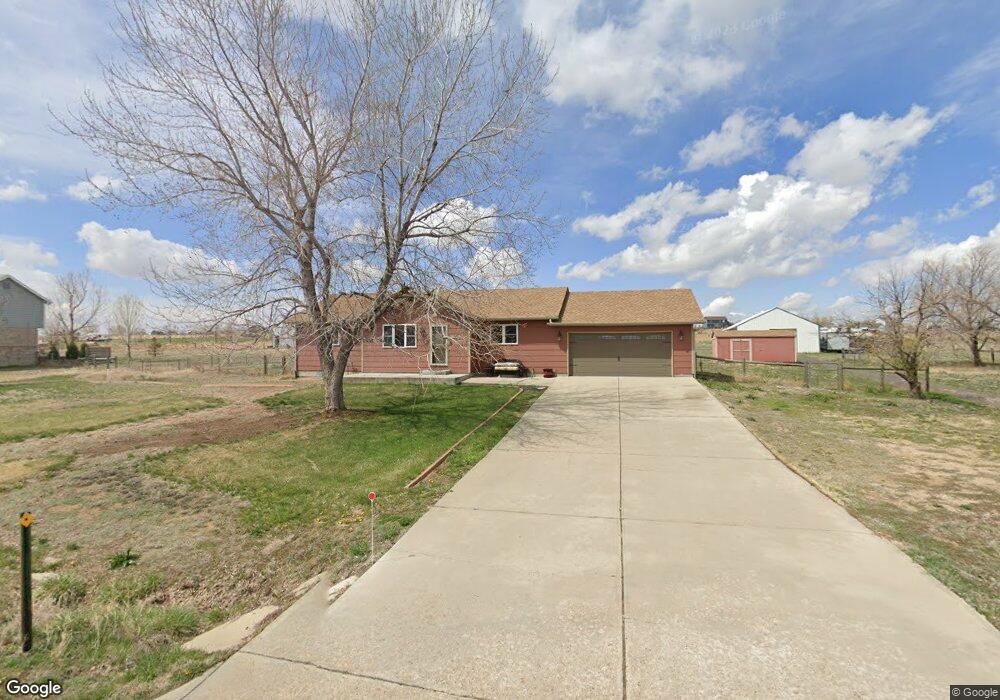
15859 Great Rock Rd Brighton, CO 80603
Estimated Value: $677,000 - $790,000
3
Beds
2
Baths
1,553
Sq Ft
$469/Sq Ft
Est. Value
About This Home
This home is located at 15859 Great Rock Rd, Brighton, CO 80603 and is currently estimated at $728,501, approximately $469 per square foot. 15859 Great Rock Rd is a home located in Adams County with nearby schools including Overland Trail Middle School, Brighton High School, and Meadowlark Montessori School.
Ownership History
Date
Name
Owned For
Owner Type
Purchase Details
Closed on
Feb 5, 2021
Sold by
Mooce Edward J and Mooce Randi M
Bought by
Mckay Barry C and Mckay Jill R
Current Estimated Value
Home Financials for this Owner
Home Financials are based on the most recent Mortgage that was taken out on this home.
Original Mortgage
$449,950
Outstanding Balance
$401,732
Interest Rate
2.6%
Mortgage Type
New Conventional
Estimated Equity
$326,769
Purchase Details
Closed on
Feb 23, 1994
Sold by
Bernards Custom Construction
Bought by
Moore Edward J and Moore Randi M
Home Financials for this Owner
Home Financials are based on the most recent Mortgage that was taken out on this home.
Original Mortgage
$107,550
Interest Rate
6.94%
Purchase Details
Closed on
Oct 19, 1993
Sold by
Front Range Devl Corp
Bought by
Bernards Custom Constr
Purchase Details
Closed on
Sep 30, 1992
Create a Home Valuation Report for This Property
The Home Valuation Report is an in-depth analysis detailing your home's value as well as a comparison with similar homes in the area
Home Values in the Area
Average Home Value in this Area
Purchase History
| Date | Buyer | Sale Price | Title Company |
|---|---|---|---|
| Mckay Barry C | $599,950 | Fitco | |
| Moore Edward J | $119,515 | -- | |
| Bernards Custom Constr | $25,000 | -- | |
| Bernards Custom Constr | -- | -- | |
| -- | $220,000 | -- |
Source: Public Records
Mortgage History
| Date | Status | Borrower | Loan Amount |
|---|---|---|---|
| Open | Mckay Barry C | $449,950 | |
| Previous Owner | Moore Edward J | $107,550 |
Source: Public Records
Tax History Compared to Growth
Tax History
| Year | Tax Paid | Tax Assessment Tax Assessment Total Assessment is a certain percentage of the fair market value that is determined by local assessors to be the total taxable value of land and additions on the property. | Land | Improvement |
|---|---|---|---|---|
| 2024 | $4,895 | $42,970 | $10,000 | $32,970 |
| 2023 | $4,871 | $50,770 | $8,460 | $42,310 |
| 2022 | $3,733 | $38,850 | $8,690 | $30,160 |
| 2021 | $3,733 | $38,850 | $8,690 | $30,160 |
| 2020 | $3,477 | $37,750 | $8,940 | $28,810 |
| 2019 | $3,480 | $37,750 | $8,940 | $28,810 |
| 2018 | $2,679 | $29,050 | $6,120 | $22,930 |
| 2017 | $2,676 | $29,050 | $6,120 | $22,930 |
| 2016 | $2,068 | $22,370 | $5,730 | $16,640 |
| 2015 | $2,063 | $22,370 | $5,730 | $16,640 |
| 2014 | $1,648 | $18,140 | $5,810 | $12,330 |
Source: Public Records
Map
Nearby Homes
- 15415 Gadsden Dr
- 29145 E 160th Ct
- 28700 E 160th Place
- 28550 E 159th Ave
- 30045 E 161st Ave
- 29780 E 162nd Ave
- 29900 E 162nd Ave
- 16101 Hardwrick St
- 30350 E 161st Ave Unit 25
- 29775 E 162nd Ave
- 30315 E 161st Ave
- 29885 E 162nd Ave Unit 4
- 30355 E 161st Ave
- 16275 Electra St
- 30460 E 161st Ave
- 30300 E 162nd Ave
- 16180 Kenosha St
- 29585 E 165th Ave
- 30344 E 165th Ave
- 30185 E 166th Ave
- 15889 Great Rock Rd
- 15809 Great Rock Rd
- 15880 Great Rock Rd
- 15900 Great Rock Rd
- 15840 Great Rock Rd
- 15800 Great Rock Rd
- 15779 Great Rock Rd
- 15860 Great Rock Rd
- 15780 Great Rock Rd
- 15709 Great Rock Rd
- 15940 Great Rock Rd
- 15722 Gadsden Dr
- 15960 Great Rock Rd
- 15740 Great Rock Rd
- 15782 Gadsden Dr
- 15689 Great Rock Rd
- 15700 Great Rock Rd
- 15742 Gadsden Dr
- 15762 Gadsden Dr
- 15979 Great Rock Rd