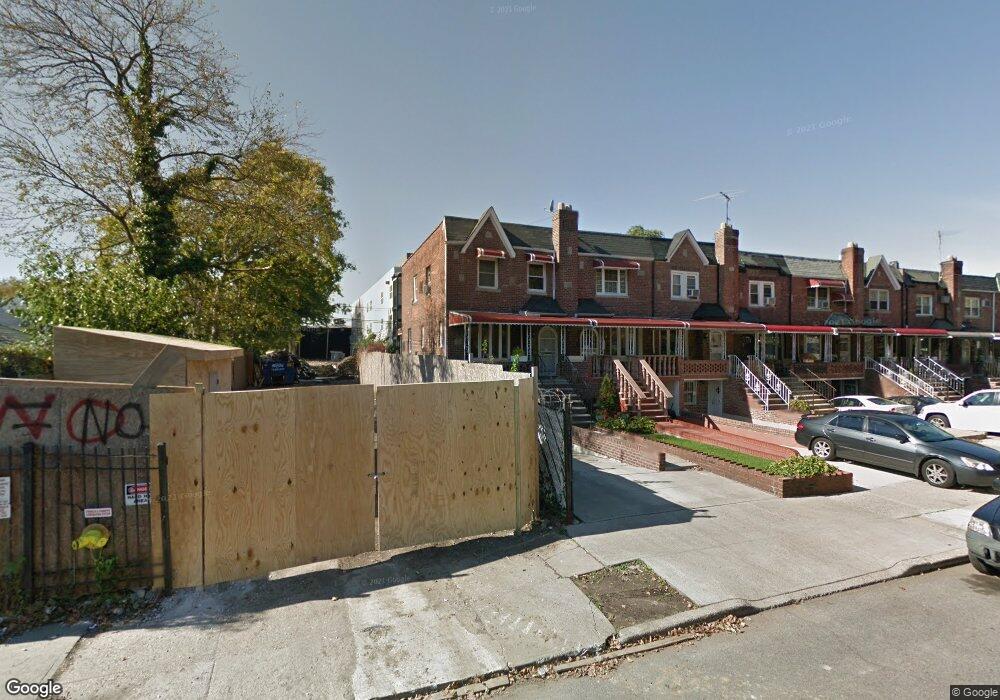
1586 Schenectady Ave Unit 1 Brooklyn, NY 11234
Flatlands NeighborhoodEstimated Value: $669,000 - $916,000
2
Beds
1
Bath
1,732
Sq Ft
$460/Sq Ft
Est. Value
About This Home
This home is located at 1586 Schenectady Ave Unit 1, Brooklyn, NY 11234 and is currently estimated at $796,624, approximately $459 per square foot. 1586 Schenectady Ave Unit 1 is a home located in Kings County with nearby schools including P.S. 109, Andries Hudde School, and Christian Heritage Academy.
Ownership History
Date
Name
Owned For
Owner Type
Purchase Details
Closed on
May 31, 2019
Sold by
Asiatic Hitchman-Lazarus Oneca and Asiatic Lazarus
Bought by
Lazarus Asiatic
Current Estimated Value
Purchase Details
Closed on
Jul 28, 2017
Sold by
Estate Of Carol Taylor and Shamecca Lazarus Exeuctor
Bought by
Hitchman-Lazarus Oneca and Lazarus Asiatic
Home Financials for this Owner
Home Financials are based on the most recent Mortgage that was taken out on this home.
Original Mortgage
$479,083
Interest Rate
3.9%
Mortgage Type
VA
Purchase Details
Closed on
Jun 12, 1998
Sold by
Port Realty Group Llc
Bought by
Taylor Phillip L and Taylor Carol
Home Financials for this Owner
Home Financials are based on the most recent Mortgage that was taken out on this home.
Original Mortgage
$173,800
Interest Rate
6.94%
Mortgage Type
FHA
Create a Home Valuation Report for This Property
The Home Valuation Report is an in-depth analysis detailing your home's value as well as a comparison with similar homes in the area
Home Values in the Area
Average Home Value in this Area
Purchase History
| Date | Buyer | Sale Price | Title Company |
|---|---|---|---|
| Lazarus Asiatic | -- | -- | |
| Hitchman-Lazarus Oneca | $469,000 | -- | |
| Taylor Phillip L | $185,000 | Long Island Title Agency |
Source: Public Records
Mortgage History
| Date | Status | Borrower | Loan Amount |
|---|---|---|---|
| Previous Owner | Hitchman-Lazarus Oneca | $479,083 | |
| Previous Owner | Taylor Phillip L | $173,800 |
Source: Public Records
Tax History Compared to Growth
Tax History
| Year | Tax Paid | Tax Assessment Tax Assessment Total Assessment is a certain percentage of the fair market value that is determined by local assessors to be the total taxable value of land and additions on the property. | Land | Improvement |
|---|---|---|---|---|
| 2025 | $5,059 | $50,160 | $11,520 | $38,640 |
| 2024 | $5,059 | $44,520 | $11,520 | $33,000 |
| 2023 | $4,921 | $39,120 | $11,520 | $27,600 |
| 2022 | $6,339 | $36,660 | $11,520 | $25,140 |
| 2021 | $6,561 | $38,640 | $11,520 | $27,120 |
| 2020 | $4,921 | $31,860 | $11,520 | $20,340 |
| 2019 | $6,567 | $31,860 | $11,520 | $20,340 |
| 2018 | $6,236 | $30,593 | $11,405 | $19,188 |
| 2017 | $5,884 | $28,862 | $10,495 | $18,367 |
| 2016 | $5,673 | $28,380 | $11,520 | $16,860 |
| 2015 | $3,284 | $27,729 | $11,908 | $15,821 |
| 2014 | $3,284 | $26,160 | $12,780 | $13,380 |
Source: Public Records
Map
Nearby Homes
- 1586 Schenectady Ave
- 1584 Schenectady Ave
- 1582 Schenectady Ave
- 1580 Schenectady Ave
- 1578 Schenectady Ave
- 1576 Schenectady Ave
- 4619 Glendale Ct
- 4623 Glendale Ct
- 1574 Schenectady Ave
- 4615 Glendale Ct
- 1572 Schenectady Ave
- 4611 Glendale Ct
- 1570 Schenectady Ave
- 1568 Schenectady Ave
- 4607 Glendale Ct
- 1566 Schenectady Ave
- 1585 Schenectady Ave
- 4603 Glendale Ct
- 1587 Schenectady Ave
- 1581 Schenectady Ave