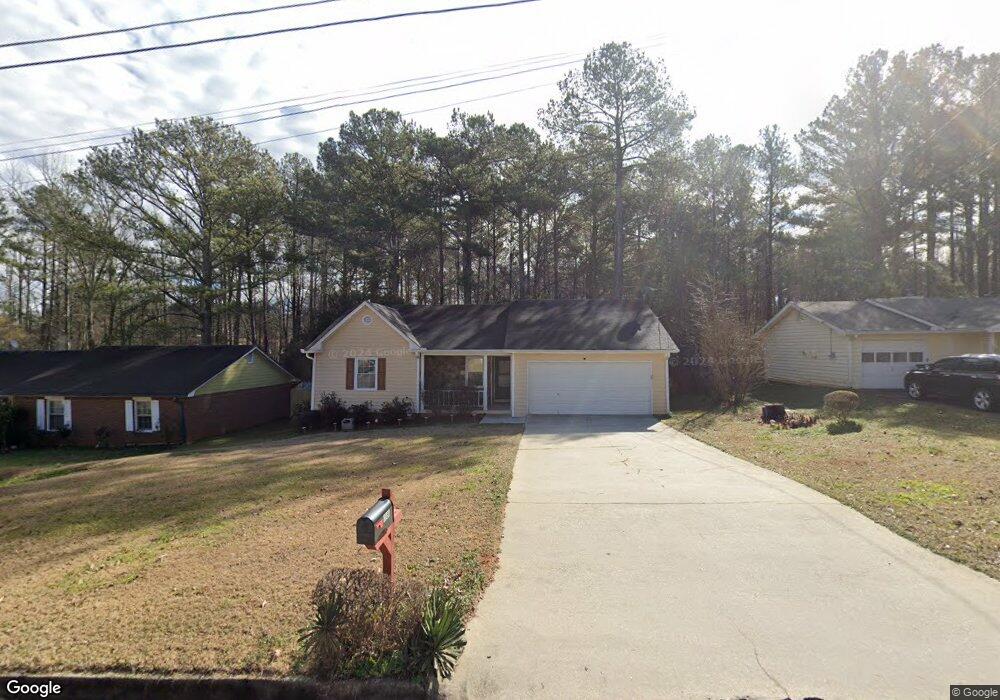
1588 Cherry Hill Ct SW Unit 1 Conyers, GA 30094
Estimated Value: $209,000 - $222,000
3
Beds
2
Baths
1,372
Sq Ft
$158/Sq Ft
Est. Value
About This Home
This home is located at 1588 Cherry Hill Ct SW Unit 1, Conyers, GA 30094 and is currently estimated at $217,192, approximately $158 per square foot. 1588 Cherry Hill Ct SW Unit 1 is a home located in Rockdale County with nearby schools including Sims Elementary School, Edwards Middle School, and Heritage High School.
Ownership History
Date
Name
Owned For
Owner Type
Purchase Details
Closed on
Sep 22, 2015
Sold by
Thomas Myrlene Hoyt
Bought by
Thomas Myrlene Hoyt and Thomas Derrick
Current Estimated Value
Home Financials for this Owner
Home Financials are based on the most recent Mortgage that was taken out on this home.
Original Mortgage
$76,587
Outstanding Balance
$61,823
Interest Rate
4.75%
Mortgage Type
FHA
Estimated Equity
$155,369
Purchase Details
Closed on
Aug 5, 2014
Sold by
Northington Virgil J
Bought by
Champagnie Osmond and Champagnie Cheddi
Purchase Details
Closed on
Jun 13, 2007
Sold by
Todd & Powers Inc
Bought by
Northington Virgil J and Knox Jennifer
Home Financials for this Owner
Home Financials are based on the most recent Mortgage that was taken out on this home.
Original Mortgage
$114,532
Interest Rate
6.1%
Mortgage Type
FHA
Purchase Details
Closed on
Nov 16, 2006
Sold by
Owen William A and Owen Teressa L
Bought by
Todd & Powers Inc
Create a Home Valuation Report for This Property
The Home Valuation Report is an in-depth analysis detailing your home's value as well as a comparison with similar homes in the area
Home Values in the Area
Average Home Value in this Area
Purchase History
| Date | Buyer | Sale Price | Title Company |
|---|---|---|---|
| Thomas Myrlene Hoyt | -- | -- | |
| Thomas Myrlene Hoyte | $92,500 | -- | |
| Champagnie Osmond | $46,900 | -- | |
| Northington Virgil J | -- | -- | |
| Todd & Powers Inc | $78,500 | -- |
Source: Public Records
Mortgage History
| Date | Status | Borrower | Loan Amount |
|---|---|---|---|
| Open | Thomas Myrlene Hoyte | $76,587 | |
| Closed | Thomas Myrlene Hoyt | $76,587 | |
| Previous Owner | Northington Virgil J | $114,532 |
Source: Public Records
Tax History Compared to Growth
Tax History
| Year | Tax Paid | Tax Assessment Tax Assessment Total Assessment is a certain percentage of the fair market value that is determined by local assessors to be the total taxable value of land and additions on the property. | Land | Improvement |
|---|---|---|---|---|
| 2024 | $1,050 | $75,920 | $15,720 | $60,200 |
| 2023 | $629 | $63,000 | $14,760 | $48,240 |
| 2022 | $572 | $48,520 | $11,120 | $37,400 |
| 2021 | $368 | $40,360 | $8,920 | $31,440 |
| 2020 | $163 | $36,240 | $7,480 | $28,760 |
| 2019 | $154 | $35,520 | $6,760 | $28,760 |
| 2018 | $103 | $29,200 | $4,560 | $24,640 |
| 2017 | $102 | $29,040 | $4,560 | $24,480 |
| 2016 | $424 | $29,040 | $4,560 | $24,480 |
| 2015 | $872 | $18,760 | $2,777 | $15,983 |
| 2014 | $180 | $21,080 | $3,120 | $17,960 |
| 2013 | -- | $24,200 | $6,000 | $18,200 |
Source: Public Records
Map
Nearby Homes
- 1598 Cherry Hill Ln SW Unit 5
- 1624 Sugarmaple Ln SW
- 1593 Cherry Hill Ln SW
- 2370 Ebenezer Rd SE
- 1675 Mccollum Rd SW
- 1461 Cherry Hill Rd SW
- 170 Old Mill Trail SW
- 1806 Mccollum Rd SW
- 309 Windsor Walk SE Unit 1
- 340 Windsor Walk SE
- 2067 Ebenezer Rd SW
- 2305 Lochinver Ln SW
- 325 Yukon Dr Unit 66
- 335 Yukon Dr Unit 61
- 341 Yukon Dr Unit 58
- 4980 SE West Lake Dr
- 4811 SE West Lake Dr
- 2631 Rolling Hills Way SE
- 2203 Liberty Ln SW Unit 2
- 1588 Cherry Hill Ct SW Unit 602/4
- 1592 Cherry Hill Ct SW
- 1596 Cherry Hill Ct SW
- 1580 Cherry Hill Ct SW Unit 1
- 1587 Cherry Hill Ct SW Unit 1
- 1591 Cherry Hill Ct SW
- 1583 Cherry Hill Ct SW
- 1600 Cherry Hill Ct SW
- 1595 Cherry Hill Ct SW
- 1576 Cherry Hill Ct SW
- 1579 Cherry Hill Ct SW Unit 1
- 1599 Cherry Hill Ct SW
- 1604 Cherry Hill Ct SW
- 1572 Cherry Hill Ct SW
- 1588 Sugarmaple Ln SW
- 1592 Sugarmaple Ln SW
- 1592 Sugarmaple Ln SW Unit 113
- 1584 Sugarmaple Ln SW
- 1603 Cherry Hill Ct SW
- 1596 Sugarmaple Ln SW