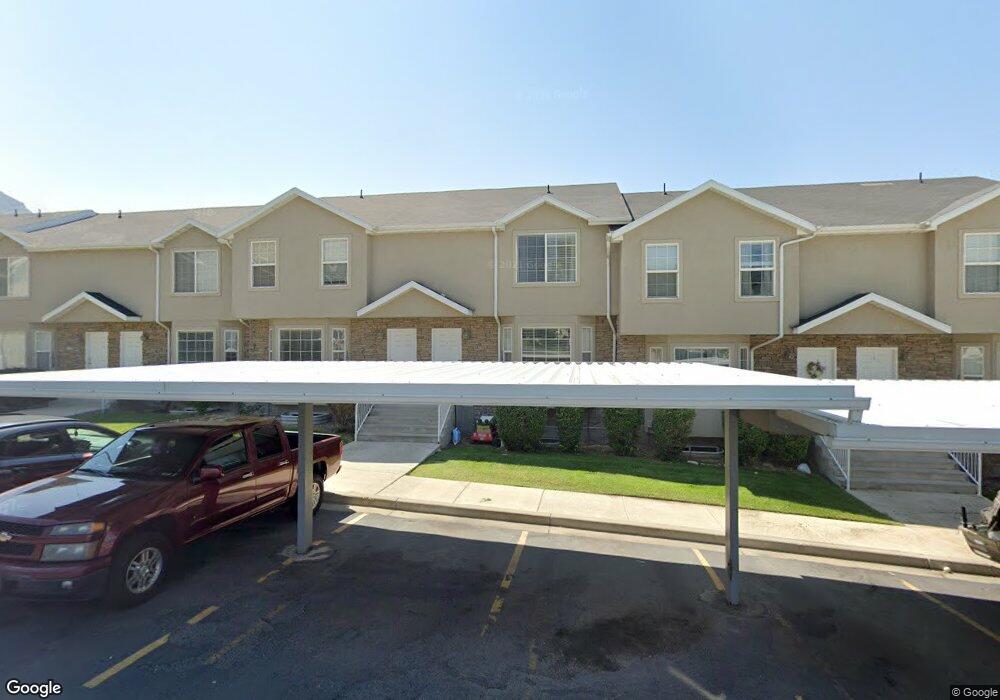
1588 E 1350 S Provo, UT 84606
Provost NeighborhoodEstimated Value: $385,716 - $417,000
3
Beds
3
Baths
2,055
Sq Ft
$196/Sq Ft
Est. Value
About This Home
This home is located at 1588 E 1350 S, Provo, UT 84606 and is currently estimated at $403,572, approximately $196 per square foot. 1588 E 1350 S is a home located in Utah County with nearby schools including Spring Creek Elementary School, Centennial Middle School, and Timpview High School.
Ownership History
Date
Name
Owned For
Owner Type
Purchase Details
Closed on
Jul 28, 2025
Sold by
Xu Xiaoqian
Bought by
Xiaoqian Xu Trust and Xu
Current Estimated Value
Purchase Details
Closed on
Jul 3, 2025
Sold by
Zhang Yong
Bought by
Xu Xiaoqian
Purchase Details
Closed on
Aug 24, 2024
Sold by
Xu Xiaoqian
Bought by
Xiaoqian Xu Trust and Xu
Purchase Details
Closed on
Jan 9, 2015
Sold by
Zhang David Chengwei
Bought by
Zhang Yong and Xu Xiaoqian
Purchase Details
Closed on
Feb 1, 2006
Sold by
Kirkham Alicia and Christensen Alicia
Bought by
Zhang David Chengwei
Home Financials for this Owner
Home Financials are based on the most recent Mortgage that was taken out on this home.
Original Mortgage
$142,200
Interest Rate
6.21%
Mortgage Type
Fannie Mae Freddie Mac
Purchase Details
Closed on
Jun 29, 2004
Sold by
D R Horton Inc
Bought by
Christensen Alicia
Home Financials for this Owner
Home Financials are based on the most recent Mortgage that was taken out on this home.
Original Mortgage
$113,900
Interest Rate
5.37%
Mortgage Type
Purchase Money Mortgage
Create a Home Valuation Report for This Property
The Home Valuation Report is an in-depth analysis detailing your home's value as well as a comparison with similar homes in the area
Home Values in the Area
Average Home Value in this Area
Purchase History
| Date | Buyer | Sale Price | Title Company |
|---|---|---|---|
| Xiaoqian Xu Trust | -- | None Listed On Document | |
| Xu Xiaoqian | -- | None Listed On Document | |
| Xiaoqian Xu Trust | -- | None Listed On Document | |
| Zhang Yong | -- | Security Title And Abstract | |
| Zhang David Chengwei | -- | Empire Land Title Company | |
| Christensen Alicia | -- | Inwest Title Services Inc |
Source: Public Records
Mortgage History
| Date | Status | Borrower | Loan Amount |
|---|---|---|---|
| Previous Owner | Zhang David Chengwei | $142,200 | |
| Previous Owner | Christensen Alicia | $113,900 |
Source: Public Records
Tax History
| Year | Tax Paid | Tax Assessment Tax Assessment Total Assessment is a certain percentage of the fair market value that is determined by local assessors to be the total taxable value of land and additions on the property. | Land | Improvement |
|---|---|---|---|---|
| 2025 | $2,101 | $205,865 | -- | -- |
| 2024 | $2,101 | $206,855 | $0 | $0 |
| 2023 | $2,048 | $198,715 | $0 | $0 |
| 2022 | $1,921 | $187,935 | $0 | $0 |
| 2021 | $1,505 | $256,900 | $38,500 | $218,400 |
| 2020 | $1,555 | $248,800 | $37,300 | $211,500 |
| 2019 | $1,458 | $242,600 | $31,500 | $211,100 |
| 2018 | $1,317 | $222,200 | $29,000 | $193,200 |
| 2017 | $1,163 | $107,800 | $0 | $0 |
| 2016 | $1,158 | $100,100 | $0 | $0 |
| 2015 | $1,108 | $96,800 | $0 | $0 |
| 2014 | $1,011 | $92,015 | $0 | $0 |
Source: Public Records
Map
Nearby Homes
- 1482 E 1280 S
- 1154 S 1430 E
- 1261 E 1500 S
- 1105 S 1420 E
- 1141 E 1320 S Unit A404
- 1141 E 1320 S Unit B401
- 1141 E 1320 S Unit D104
- 1141 E 1320 S Unit D303
- 1225 E 1600 South St Unit 12
- 1225 E 1600 South St Unit 4
- 1052 Canyon Meadow Dr Unit 4
- 1077 Canyon Meadow Dr Unit 7
- 1778 S Buckley Ln
- 1332 Cinnamon Ridge Way
- 1304 E 900 S
- 1263 S 1000 E
- 1754 California Ave
- 1184 S 1000 E
- 1156 S 1000 E
- 1417 E 700 S
Your Personal Tour Guide
Ask me questions while you tour the home.