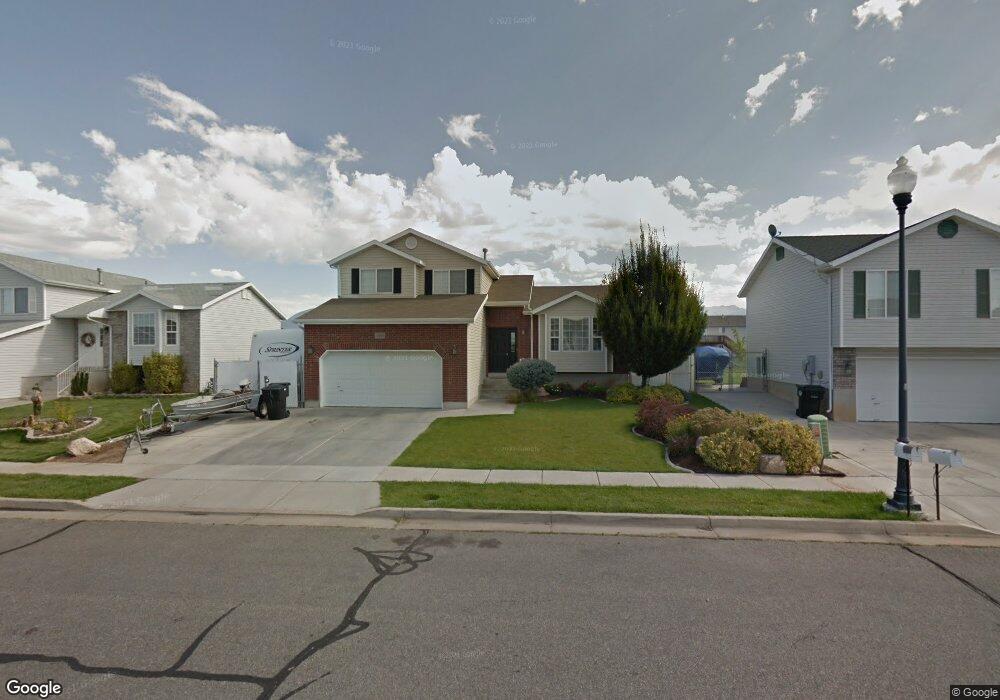
1588 N 2275 W Clearfield, UT 84015
Estimated Value: $452,645 - $498,000
4
Beds
4
Baths
1,567
Sq Ft
$305/Sq Ft
Est. Value
About This Home
This home is located at 1588 N 2275 W, Clearfield, UT 84015 and is currently estimated at $477,161, approximately $304 per square foot. 1588 N 2275 W is a home located in Davis County with nearby schools including West Clinton Elementary School, West Point Junior High School, and Syracuse High School.
Ownership History
Date
Name
Owned For
Owner Type
Purchase Details
Closed on
Feb 14, 2008
Sold by
Saddler Steven E and Saddler Brenda K
Bought by
Saddler Steven E and Saddler Brenda Kaye
Current Estimated Value
Home Financials for this Owner
Home Financials are based on the most recent Mortgage that was taken out on this home.
Original Mortgage
$159,500
Outstanding Balance
$99,042
Interest Rate
5.85%
Mortgage Type
New Conventional
Estimated Equity
$378,119
Purchase Details
Closed on
May 4, 1999
Sold by
Mark Higley Construction Lc
Bought by
Saddler Steven E and Saddler Brenda K
Home Financials for this Owner
Home Financials are based on the most recent Mortgage that was taken out on this home.
Original Mortgage
$123,950
Interest Rate
6.96%
Create a Home Valuation Report for This Property
The Home Valuation Report is an in-depth analysis detailing your home's value as well as a comparison with similar homes in the area
Home Values in the Area
Average Home Value in this Area
Purchase History
| Date | Buyer | Sale Price | Title Company |
|---|---|---|---|
| Saddler Steven E | -- | Inwest Title Services Inc | |
| Saddler Steven E | -- | First American Title Co |
Source: Public Records
Mortgage History
| Date | Status | Borrower | Loan Amount |
|---|---|---|---|
| Open | Saddler Steven E | $159,500 | |
| Closed | Saddler Steven E | $123,950 |
Source: Public Records
Tax History Compared to Growth
Tax History
| Year | Tax Paid | Tax Assessment Tax Assessment Total Assessment is a certain percentage of the fair market value that is determined by local assessors to be the total taxable value of land and additions on the property. | Land | Improvement |
|---|---|---|---|---|
| 2025 | $2,523 | $242,550 | $92,179 | $150,371 |
| 2024 | $2,430 | $234,850 | $101,135 | $133,715 |
| 2023 | $2,209 | $395,000 | $115,398 | $279,602 |
| 2022 | $2,368 | $234,300 | $70,185 | $164,115 |
| 2021 | $2,167 | $318,000 | $88,547 | $229,453 |
| 2020 | $1,880 | $273,000 | $75,603 | $197,397 |
| 2019 | $1,825 | $259,000 | $87,675 | $171,325 |
| 2018 | $1,800 | $251,000 | $73,966 | $177,034 |
| 2016 | $1,538 | $110,715 | $28,879 | $81,836 |
| 2015 | $1,547 | $105,875 | $28,879 | $76,996 |
| 2014 | $1,535 | $106,755 | $28,879 | $77,876 |
| 2013 | -- | $99,189 | $27,143 | $72,046 |
Source: Public Records
Map
Nearby Homes
- 1694 N 2225 W
- 2259 W 1800 N
- 2148 W 1570 N
- 1458 N 2400 W
- 1509 N 2475 W
- 1449 N 2475 W
- 1665 N 1960 W
- 2371 W 1300 N
- 2642 W 1500 N
- 2616 N 2125 W Unit 147
- 1251 N 2525 W
- 1923 W 1340 N
- 1331 N 1850 W
- 2162 N 2290 W
- Harvard Plan at Summerfield - Enclave
- 2208 W 2615 N
- Linden Plan at Summerfield - Vista
- Yale Plan at Summerfield - Enclave
- Gambel Oak Plan at Summerfield - Vista
- Cedar Plan at Summerfield - Vista